Transformer Oil Market (2026-2036)
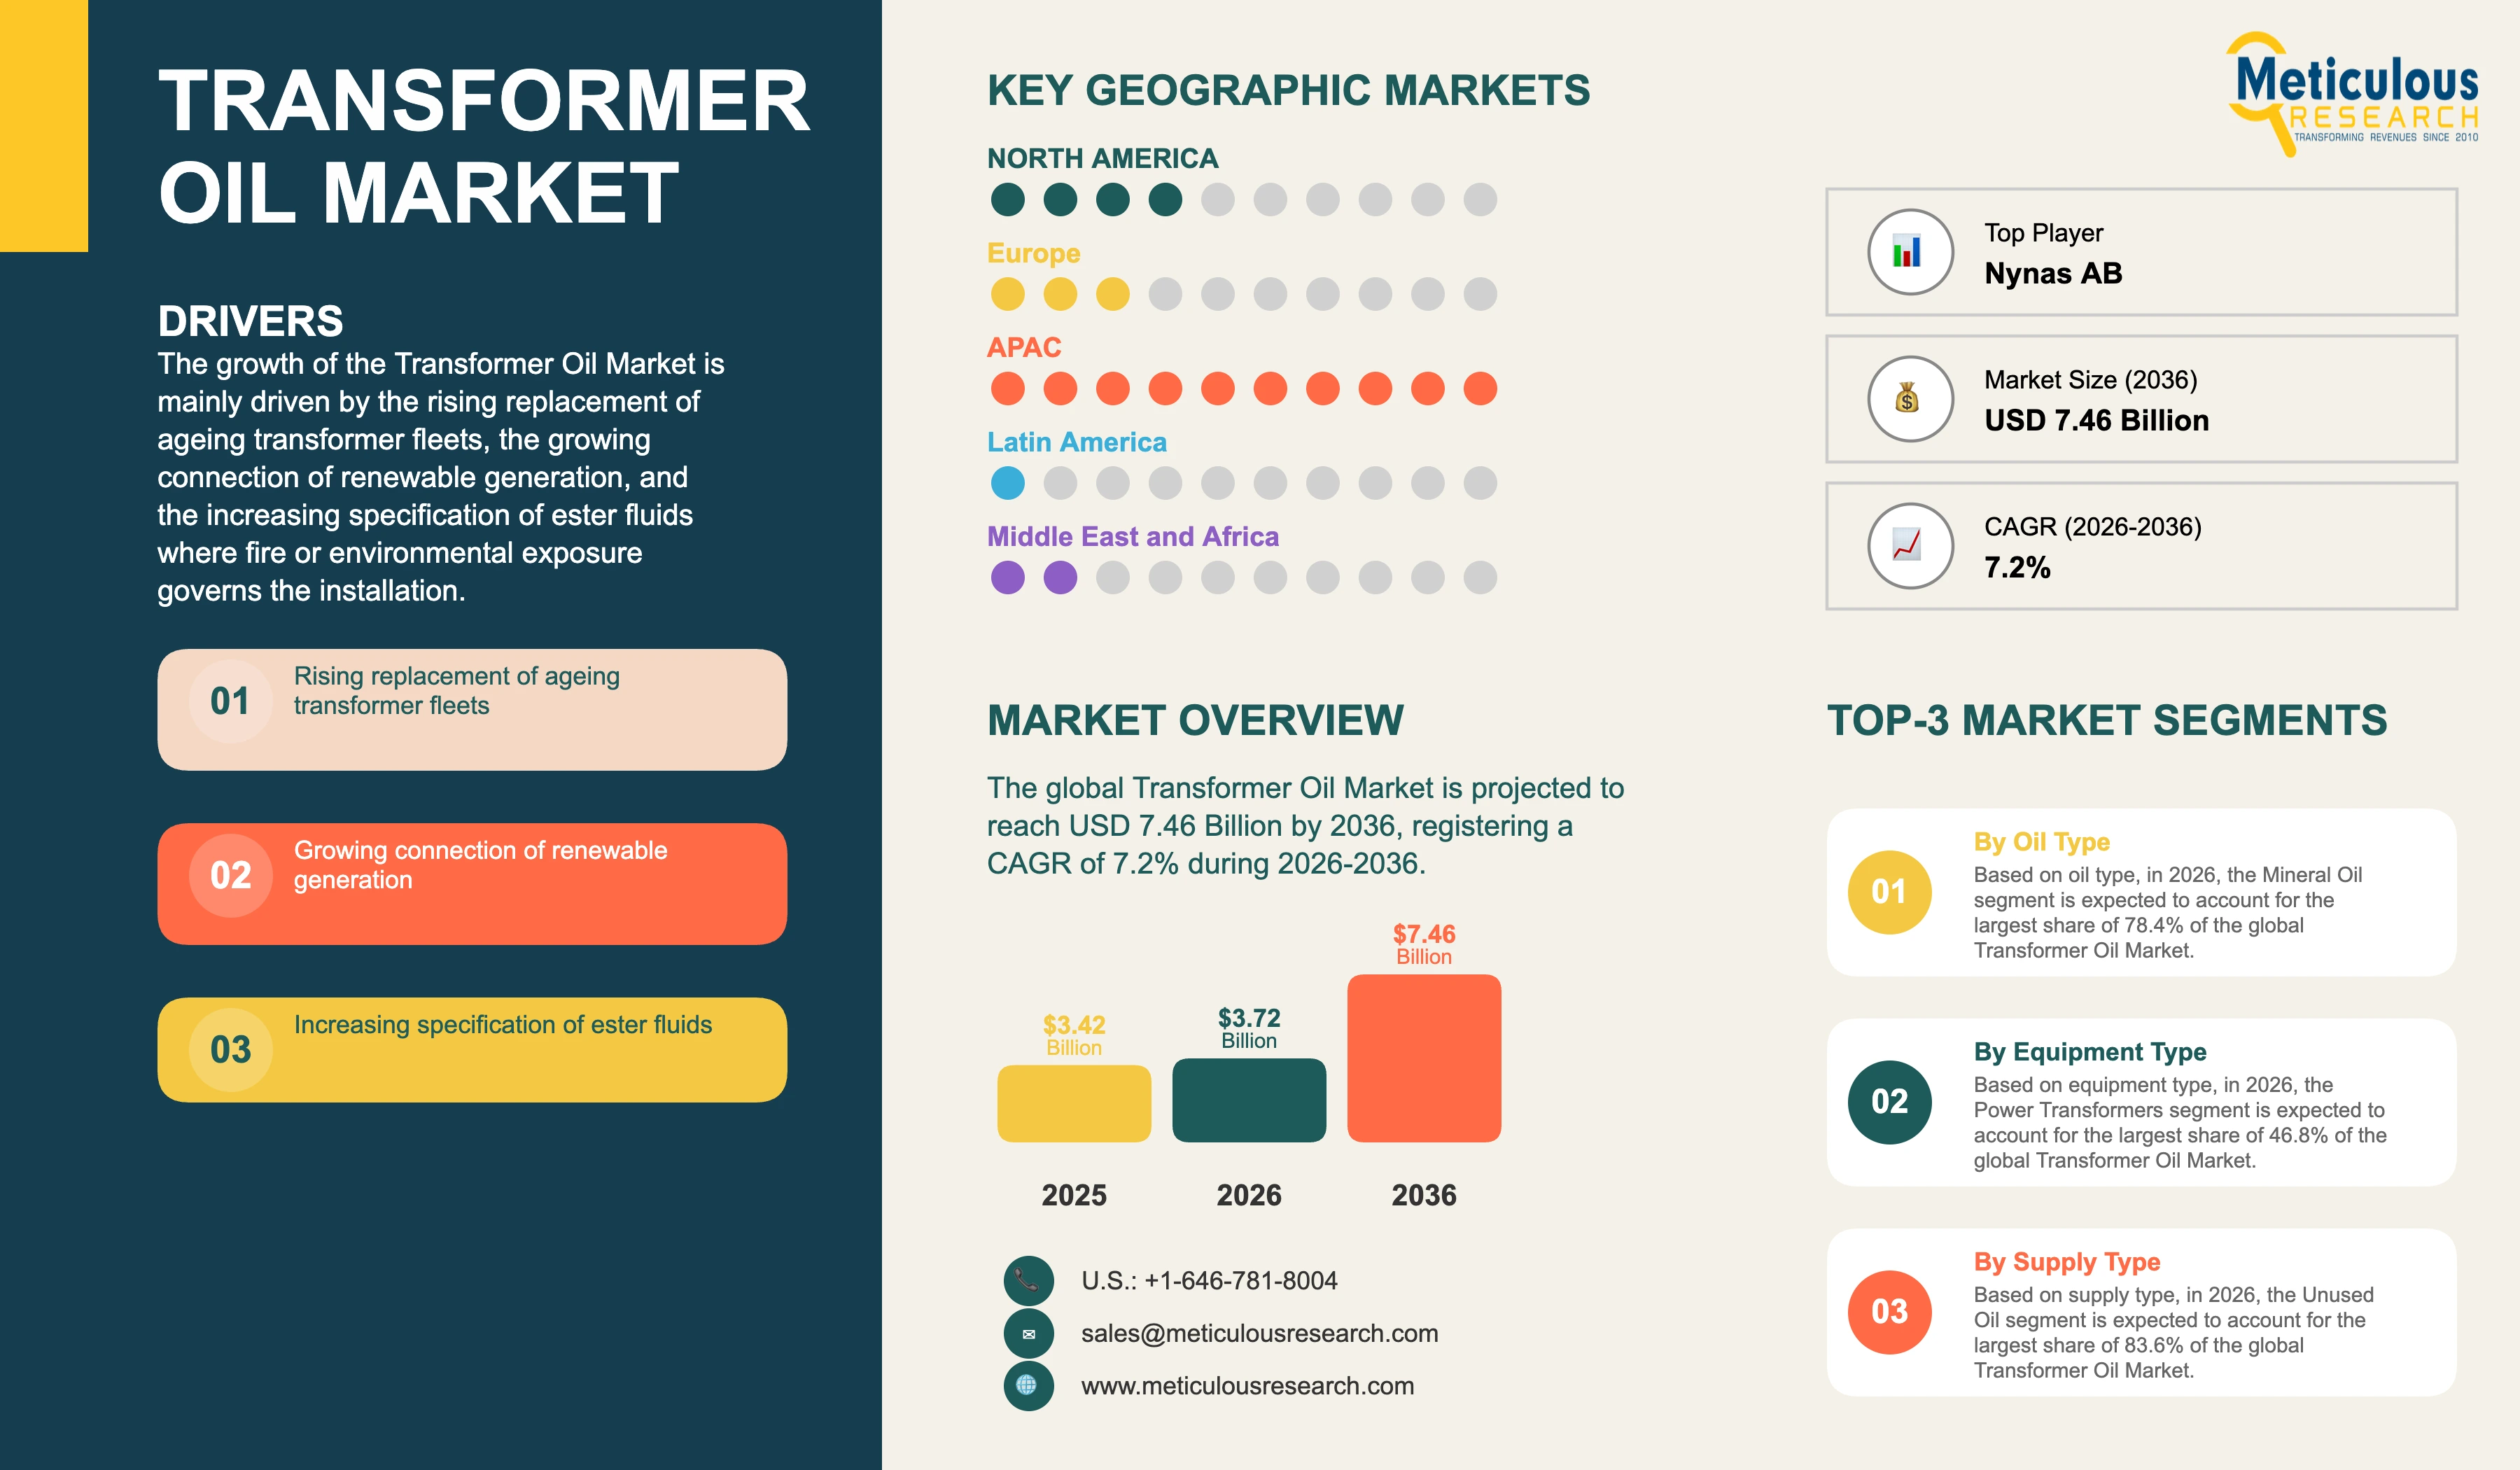
The global transformer oil market was valued at USD 3.42 billion in 2025. This market is expected to reach USD 7.46 billion by 2036 from an estimated USD 3.72 billion in 2026, registering a CAGR of 7.2% during the forecast period (2026-2036).
- Published
- Nov 2026
- Pages
- 278
- Format
- PDF + Excel
- Report ID
- MREP - 1042467
- Base year
- 2025
- 2025 · BASELINE
- $3.42B
- 2036
- $7.46B
- CAGR 2026–2036
- 7.2%
2025 baseline · 2026–2036 forecast at 7.2% CAGR · hover a bar for the value
Key highlights
IEC 60296:2020 was published on 26 June 2020 as the fifth version of the mineral insulating oil specification and carries a stability date of 2030.
That standard places recycled oil re-refined or reclaimed offsite on the same specification footing as unused oil, which is the commercial basis of the reclamation segment.
Oil treated on site falls outside IEC 60296 and under IEC 60422 instead, which separates on-site treatment as a service from offsite re-refining as a product.
The standard defines two categories of transformer insulating oil, Type A and Type B, and adds a stray gassing test developed jointly by CIGRE D1 and IEC TC 10.
United States spill prevention rules define oil to include vegetable oils, so a natural ester fill does not remove the containment and plan obligation.
A facility is exempt from those rules only below 1, 320 gallons of aggregate aboveground capacity, which a substation with a few medium transformers exceeds.
Natural esters are the fastest-growing oil type at a CAGR of 14.8%, from a base of USD 431.5 million in 2026.
The average price rises from USD 1.40 per litre in 2026 to USD 1.65 per litre by 2036 as ester volumes build.
By oil type, mineral oil accounts for the largest share of 78.4% in 2026, while natural esters register the highest CAGR.
By equipment type, power transformers account for the largest share of 46.8% and also the highest CAGR of 7.8%.
By supply type, unused oil accounts for the largest share of 83.6%, while recycled oil registers the higher CAGR of 10.4%.
By end user, utilities and transmission system operators account for the largest share of 58.6%, while renewable generation registers the highest CAGR of 9.4%.
By geography, Asia-Pacific accounts for the largest share of 48.6% in 2026, while the Middle East & Africa registers the highest CAGR of 8.2%.
Report summary
| Particulars | Details |
|---|---|
| Base Year | 2025 |
| Estimated Year | 2026 |
| Forecast Period | 2026-2036 |
| Market Size in 2025 | USD 3.42 billion (2,480 million litres) |
| Market Size in 2026 | USD 3.72 billion (2,660 million litres) |
| Market Size by 2036 | USD 7.46 billion (4,520 million litres) |
| CAGR (2026-2036) | 7.2% by value and 5.4% by volume |
| Format | PDF, Excel & Cloud Portal · 278 pages |
| Average Price | USD 1.40 per litre in 2026 to USD 1.65 per litre by 2036 |
| Largest Segment by Oil Type (2026) | Mineral oil (78.4%) |
| Fastest-Growing Segment by Oil Type | Natural esters (CAGR 14.8%) |
| Largest Region (2026) | Asia-Pacific (48.6%) |
| Fastest-Growing Region | Middle East & Africa (CAGR 8.2%) |
| Companies Profiled | 17 companies and other companies |
| Segments Covered | Oil Type, Equipment Type, Supply Type, End User, Geography |
| Countries Covered | China, India, Japan, South Korea, Australia, Indonesia, Rest of Asia-Pacific, U.S., Canada, Germany, France, Italy, U.K., Spain, Sweden, Rest of Europe, Saudi Arabia, U.A.E., Egypt, South Africa, Rest of Middle East & Africa, Brazil, Mexico, Argentina, Rest of Latin America |
Report overview
Segments covered: oil type, equipment type, supply type, end user.
The growth of this market is mainly driven by the rising replacement of transformer fleets installed in the second half of the twentieth century, the growing connection of renewable generation that adds step-up and collector transformers to the network, the increasing specification of ester fluids where fire separation distances or environmental exposure govern the installation, and the expanding use of condition monitoring that converts oil from a commodity purchase into a managed asset. However, factors such as the long qualification cycle for a change of fluid in a transformer population, the limited number of refineries producing naphthenic base oil of transformer grade, the higher viscosity and purchase price of ester fluids against mineral oil, and spill prevention obligations that apply irrespective of which fluid is selected are expected to restrain the growth of this market to some extent.
In volume terms, consumption is expected to reach 4,520 million litres by 2036 from an estimated 2,660 million litres in 2026 and 2,480 million litres in 2025, registering a CAGR of 5.4% during the forecast period, with the average price rising from USD 1.40 per litre to USD 1.65 per litre as ester fluids priced well above mineral oil take a larger share of the litres sold.
Value grows faster than volume because the growth in litres is concentrated in ester fluids carrying several times the price of mineral oil, so the average price per litre rises on mix while mineral oil pricing continues to follow base oil and crude conditions.
Transformer oil insulates the windings of a transformer and carries heat from the core to the tank and radiators, and the fluid is selected against the dielectric, thermal, oxidation and gassing behaviour the equipment maker specifies rather than against price alone. Demand comes in two forms that behave differently, the first fill shipped with new equipment and the replacement or top-up volume consumed by an installed fleet, and the second is the larger and steadier of the two.
IEC 60296:2020, Fluids for electrotechnical applications, Mineral insulating oils for electrical equipment, published on 26 June 2020 as the fifth version replacing the 2012 fourth version, with a stability date of 2030 specifies requirements and test methods for mineral insulating oils in the delivered state for transformers, switchgear and similar equipment requiring insulation and heat transfer, excludes oils used as impregnants in cables and capacitors, defines two categories of transformer insulating oil designated Type A and Type B by performance, includes oils with and without additives, and introduces a test method for stray gassing under thermo-oxidative stress developed in a joint round robin between CIGRE D1 and IEC TC 10. Beyond the categories, the standard covers both unused oil refined, modified or blended from virgin petroleum feedstock and recycled oil re-refined or reclaimed offsite from oil previously used in electrical equipment, while oil treated on site is excluded and falls under IEC 60422. Recycled oil that meets the specification can therefore be sold against the same acceptance criteria as virgin oil, which is what makes reclamation a product business rather than a disposal route, and the exclusion of on-site treatment draws the commercial line between a fluid sold by the litre and a service sold by the transformer.
Ester fluids sit under separate standards from mineral oil, so a utility changing fluid type changes its whole acceptance specification and its testing regime rather than only its purchase order, which is the reason conversion proceeds by application rather than across a fleet, with esters specified where fire separation distances inside buildings or close to structures govern the installation and where a spill would reach water or soil that matters.
Part 112 of Title 40 of the Code of Federal Regulations, Oil Pollution Prevention, requires owners and operators of covered facilities to prepare and implement a written spill prevention, control and countermeasure plan certified by a licensed professional engineer unless the facility qualifies for self certification, and the definition of oil in that part begins with oil of any kind or in any form and expressly includes fats, oils or greases of animal, fish or marine mammal origin and vegetable oils including oils from seeds, nuts, fruits or kernels, and a facility is exempt only where completely buried storage capacity is 42,000 United States gallons or less and aggregate aboveground capacity is 1,320 United States gallons or less counting containers of 55 gallons or greater. A natural ester fill does not remove that obligation, because the definition of oil reaches vegetable oils explicitly, and a substation holding a few medium transformers exceeds the aboveground threshold comfortably. The case for an ester therefore rests on fire performance, transformer loading and asset life rather than on escaping containment cost, and buyers who were sold the latter have found the containment bund required either way.
Supply of transformer-grade mineral oil depends on naphthenic base oil, which is produced from a limited set of crude slates at a small number of refineries, and that concentration gives the market a supply profile closer to a specialty chemical than to a fuel. Paraffinic grades serve part of the demand where ambient temperatures permit the higher pour point, and the balance between the two shifts with regional climate and with base oil availability rather than with technical preference.
Replacement demand is being brought forward by the age of the installed fleet. Transformers commissioned in the decades of fastest network expansion are reaching the end of their design life together, and a replacement carries a first fill while a life extension carries a reclamation or a retrofill, so both routes generate volume. Utilities deciding between the two assess the condition of the paper insulation rather than the condition of the oil, since the oil can be restored and the paper cannot.
Dissolved gas analysis, furan testing and moisture measurement give an owner a record of how a specific fill is behaving in a specific unit, and a fluid that holds its properties through that record justifies a premium that a specification sheet alone would not. Suppliers selling test programmes alongside the fluid consequently hold positions that survive a procurement cycle focused on price per litre, and condition monitoring has changed how the fluid is bought as much as it has changed when it is replaced.
Asia-Pacific, with a 48.6% share in 2026 valued at USD 1,807.9 million, at a CAGR of 7.4%.
The Middle East & Africa, at a CAGR of 8.2%, valued at USD 394.3 million in 2026.
Europe accounts for 16.4% of the market in 2026, valued at USD 610.1 million, at a CAGR of 6.4%, led by Germany, France, Italy, the U.K. and the Nordic countries, with the highest regional share of ester fluids.
The Middle East & Africa accounts for 10.6% in 2026, valued at USD 394.3 million, at a CAGR of 8.2%, and Latin America for 6.2%, valued at USD 230.7 million, at a CAGR of 6.8%.
The report profiles 17 companies, including Nynas AB, Ergon, Inc., Shell plc, Exxon Mobil Corporation and Cargill, Incorporated. The top five players account for an estimated 38.4% of the market in 2026.
Unused oil, with an 83.6% share in 2026 valued at USD 3,109.9 million.
Recycled oil, at a CAGR of 10.4%, valued at USD 610.1 million in 2026.
Utilities and transmission system operators, with a 58.6% share in 2026 valued at USD 2,179.9 million, at a CAGR of 7.2%.
Renewable generation, at a CAGR of 9.4%, valued at USD 438.9 million in 2026.
Report infographic
Market dynamics
15 factors across 5 forcesRising replacement of ageing transformer fleets
Transformers installed during the decades of fastest network expansion are reaching the end of their design life in large numbers at once, and a utility facing that position either replaces the unit or extends its life. A replacement carries a first fill of several thousand litres for a power transformer, while a life extension carries reclamation of the existing charge or a complete retrofill, so both decisions generate demand for this market. Capital constraints push many owners toward life extension, which favours the reclamation and service volume over first fill.
Failure consequences have risen with network loading, because a transformer outage in a constrained network affects more load than the same outage would have affected when the unit was installed. Owners therefore spend on fluid condition and on replacement earlier in the degradation curve than they once did, and the spend is approved against the cost of an unplanned outage rather than against the price of the oil or of the unit.
Growing connection of renewable generation
Wind and solar plants require step-up transformers at each generating unit or string and collector transformers at the substation, which adds oil-filled equipment to the network in proportion to connected capacity rather than to energy delivered. Because renewable capacity factors are lower than thermal plant, more transformer capacity is installed per unit of annual generation, and the fluid volume per megawatt hour supplied is higher than in the generation it displaces. Each new connection also brings its own first fill at commissioning.
Offshore and remote installations have pushed specification toward fluids with better fire and environmental behaviour, because access for firefighting is limited and a spill at those sites is expensive to contain. Ester fluids consequently take a disproportionate share of renewable connection work relative to their share of the market as a whole, and renewable generation is the fastest-growing end user group on that basis.
Increasing specification of ester fluids where fire or environmental exposure governs
A transformer installed inside a building, in a tunnel, close to a structure or above a water course is governed by fire separation distances and spill consequences rather than by the cost of the fluid, and the higher fire point of ester fluids allows a shorter separation distance or removes the need for a fire wall. The saving in civil works at a constrained site exceeds the premium on the fluid several times over, which is why urban substations, rail installations and building-integrated transformers convert first.
Biodegradability carries weight where a release would reach soil or surface water and the remediation cost rather than the fine is the exposure. Asset owners in water catchments, protected areas and dense urban sites therefore specify esters as the default for new units while retaining mineral oil elsewhere, which produces a mixed fleet and a lasting demand for both fluids rather than a transition from one to the other.
Expanding use of condition monitoring and oil management programmes
Dissolved gas analysis, moisture measurement, furan testing and oxidation stability tracking give an owner a record of how a fill is performing in a specific unit, and that record supports a decision to reclaim, retrofill or replace before a failure. Oil moves from a commodity purchased on price to a managed asset with a measured condition, and the owner buys a programme rather than a drum. Suppliers able to provide the testing, the interpretation and the fluid hold the account through procurement cycles that would otherwise go to the lowest price per litre.
The same programmes are generating the data that justifies reclamation over replacement, since a fill whose degradation is documented can be restored to specification with a known result. Volume therefore shifts toward recycled oil and toward on-site treatment as monitoring coverage widens across a fleet.
Table of contents
12 chapters · 136 sections · 278 pages · click to expandSegmental analysis
| Segment | Largest share (2026) | Fastest growth (2026–2036) |
|---|---|---|
| By Oil Type | Mineral oil | Rapid growth of this |
| By Equipment Type | Power transformers | Large share and rapid growth of this |
| By Supply Type | Unused oil | — |
| By End User | Utilities and transmission system operators | Rapid growth of this |
By Oil Type
- The mineral oil segment is expected to account for the largest share of 78.4% of the global transformer oil market, valued at USD 2,916.5 million.
- The large share of this segment is mainly due to an established specification with a long acceptance history, a price several times below ester fluids, and a viscosity that supports the cooling design of the installed transformer population.
- Naphthenic grades account for the majority of mineral oil consumption at a share of 72.4% within the segment, on the strength of low pour point and good oxidation behaviour, with paraffinic grades at 27.6% serving demand in warmer climates where the higher pour point is acceptable and where regional base oil supply favours them.
- Synthetic esters account for 6.8%, valued at USD 253.0 million, growing at a CAGR of 12.4% in traction, offshore and high-temperature duty.
- However, the natural ester segment, valued at USD 431.5 million in 2026 and accounting for a share of 11.6%, is projected to register the highest CAGR of 14.8% during the forecast period.
- The rapid growth of this segment is attributed to a higher fire point that shortens the separation distance required at constrained sites, biodegradability where a release would reach soil or surface water, and specification at design stage on renewable connection projects.
- Silicone and other fluids account for 3.2%, valued at USD 119.0 million, in specialised high temperature applications.
- Fluid type in this market is settled by the constraints of the site and the rating of the transformer design rather than by the preference of the buyer, so the type mix moves with the installation conditions of new and retrofitted units.
- Mineral oil, with a 78.4% share in 2026 valued at USD 2,916.5 million.
- Natural esters, at a CAGR of 14.8%, valued at USD 431.5 million in 2026, ahead of synthetic esters at 12.4%.
By Equipment Type
- Transformer Oil Analysis by Equipment Type
- The power transformers segment is expected to account for the largest share of 46.8% of the market, valued at USD 1,741.0 million, and is also projected to register the highest CAGR of 7.8% during the forecast period.
- The large share and rapid growth of this segment are mainly due to fill volumes running to tens of thousands of litres per unit, replacement of transmission assets reaching the end of their design life, and the addition of collector and step-up units on renewable connection projects.
- Distribution transformers account for 34.2%, valued at USD 1,272.2 million, growing at a CAGR of 6.8%, with small fills per unit and very large unit counts, and with sealed designs that consume little replacement volume over their life.
- Switchgear and circuit breakers account for 11.4%, valued at USD 424.1 million, growing more slowly as vacuum and gas-insulated equipment displaces oil-filled designs in new installations.
- Instrument transformers, reactors and other equipment account for 7.6%, valued at USD 282.7 million.
- Fill volume per unit rather than unit count drives the value split across equipment types, which is why power transformers hold the largest share from a far smaller installed population than distribution transformers carry, and why switchgear contributes less than its unit numbers suggest.
- Sealed distribution designs also consume little replacement volume across their service life, so the equipment mix in value terms is weighted further toward power transformers than the installed oil charge alone would indicate.
- Power transformers, with a 46.8% share in 2026 valued at USD 1,741.0 million.
- Power transformers, at a CAGR of 7.8%, against 6.8% for distribution transformers.
By Supply Type
- The unused oil segment is expected to account for the largest share of 83.6% of the market, valued at USD 3,109.9 million.
- The large share of this segment is mainly due to first fill demand on new equipment, to acceptance specifications written around virgin feedstock, and to the limited processing capacity available for reclamation relative to the size of the installed charge.
- Recycled oil, valued at USD 610.1 million in 2026 and accounting for a share of 16.4%, grows at a CAGR of 10.4% against 6.6% for unused oil.
- The faster growth of recycled oil is attributed to its coverage under the same specification as unused oil, which allows a reclaimed charge to be sold on the same acceptance terms rather than disposed of as waste, to an input cost far below virgin base oil, and to capital-constrained utilities extending transformer life rather than replacing units.
- Positions in this segment are regional because transporting used oil long distances consumes the margin, and processing capacity rather than feedstock availability limits how fast the segment can grow.
- Acceptance of a reclaimed charge also depends on the owner testing regime rather than on the processor alone, so utilities with established oil management programmes convert to recycled oil earlier than those without.
By End User
- The utilities and transmission system operators segment is expected to account for the largest share of 58.6% of the market, valued at USD 2,179.9 million, growing at a CAGR of 7.2%.
- The large share of this segment is mainly due to ownership of the transmission and distribution transformer population, which is the overwhelming majority of oil-filled equipment in service, and to replacement programmes running across fleets commissioned decades apart.
- Industrial users account for 22.4%, valued at USD 833.3 million, growing at a CAGR of 6.6% in process plant, mining, steel and petrochemical substations.
- Commercial and infrastructure users account for 7.2%, valued at USD 267.9 million, in buildings, data centres, rail and airports where indoor installation frequently decides the fluid.
- However, the renewable generation segment, valued at USD 438.9 million in 2026 and accounting for a share of 11.8%, is projected to register the highest CAGR of 9.4% during the forecast period.
- The rapid growth of this segment is attributed to transformer capacity installed in proportion to connected capacity rather than to energy delivered, which raises fluid volume per unit of annual output, and to offshore and remote sites specifying higher fire point fluids at design stage.
- End user mix also determines which supply type is bought, since capital-constrained utilities drive reclamation volume while developers building new plant buy first fill, and the two groups therefore sit in different parts of the supply chain and are reached through different channels.
- Commercial and infrastructure demand is small in litres but decides fluid type more often than any other group, because indoor installation is the condition under which an ester becomes the only workable fill at the site.
Geographic analysis
Asia-Pacific
Largest shareIn 2026, Asia-Pacific is expected to account for the largest share of 48.6% of the global transformer oil market, valued at USD 1,807.9 million, growing at a CAGR of 7.4% during the forecast period. The large share of this region is mainly due to network construction continuing alongside replacement, which is a combination no other region carries at the same scale, and to transformer manufacture being located in the same countries that consume the fluid. China holds the largest national position in both manufacture and consumption, India contributes both rapid network expansion and a domestic transformer oil refining base, and Japan and South Korea contribute higher value grades and ester volumes. Transformer manufacture located alongside consumption also means first fill demand is recognised in the region where the equipment is built rather than where it is installed.
North America
North America accounts for 18.2% of the market in 2026, valued at USD 677.0 million, at a CAGR of 7.0%. Demand in the United States is driven by replacement of an ageing transmission and distribution fleet, by renewable connection, and by spill prevention requirements that make containment and documented fluid condition part of routine substation practice. Canada contributes a smaller base weighted toward hydroelectric transmission and remote network assets where cold-climate pour point requirements favour naphthenic grades.
Europe
Europe accounts for 16.4% of the market in 2026, valued at USD 610.1 million, at a CAGR of 6.4%. Germany, France, Italy, the United Kingdom and the Nordic countries lead, with demand weighted toward replacement and retrofill rather than network growth, and with the highest regional share of ester fluids because urban substations, building-integrated transformers and water catchment sites are common and fire and spill rules are applied strictly.
Middle East & Africa
Fastest growthThe Middle East & Africa accounts for 10.6% of the market in 2026, valued at USD 394.3 million, and is projected to register the highest CAGR of 8.2% during the forecast period, led by Saudi Arabia, the United Arab Emirates, Egypt and South Africa where new generation and network capacity is being built rather than replaced and where high ambient temperatures place particular demand on oxidation stability.
Latin America
Latin America accounts for 6.2%, valued at USD 230.7 million, at a CAGR of 6.8%, with Brazil and Mexico carrying most of the activity on network reinforcement and renewable connection, and with ester adoption still confined to a small number of urban and industrial installations in the larger cities of the region.
Competitive landscape
Integrated oil companies, naphthenic base oil specialists, ester fluid producers and regional blenders divide this market between them, and the base oil position rather than the blending operation decides who can supply at scale. Naphthenic base stock comes from a limited set of crude slates at a small number of refineries, so suppliers holding that capacity quote with a certainty that blenders buying on the open market cannot match, and that certainty decides long-term utility contracts as often as price does, particularly on multi-year frameworks.
Ester fluids are supplied by a different group, with agricultural processors holding the natural ester position through access to vegetable oil feedstock and chemical producers holding synthetic esters and silicone fluids. Competition there runs on qualification with transformer makers rather than on fluid price, because the fluid must be approved for the design before it can be specified, and an approval held on a widely built platform is worth more than a lower quotation.
Regional blenders and reclaimers hold positions that global suppliers find difficult to contest, because transporting used oil long distances consumes the margin on reclamation and because utility tenders frequently require local stock and service capability. The structure of the market is therefore global in base oil and regional in supply, and share at national level differs substantially from share measured worldwide, which is why a global ranking describes the base oil position rather than the supply position in any one country.
Competition has also moved toward programmes rather than products, with suppliers offering sampling, laboratory analysis and interpretation alongside the fluid in order to hold accounts through procurement cycles decided on price per litre. Suppliers able to provide testing, interpretation and the fluid itself obtain visibility of fleet condition before a tender is issued, which converts into first refusal on reclamation and retrofill work.
Some of the key players operating in the transformer oil market are Nynas AB, Ergon, Inc., Shell plc, Exxon Mobil Corporation, TotalEnergies SE, Petroliam Nasional Berhad, China Petroleum & Chemical Corporation, PetroChina Company Limited, Idemitsu Kosan Co., Ltd., Cargill, Incorporated, Hitachi Energy Ltd, Dow Inc., Calumet, Inc., Apar Industries Limited, Savita Oil Technologies Limited, Gandhar Oil Refinery (India) Limited, and Hyrax Oil Sdn. Bhd., among others.
- —
IEC 60296:2020 remains the governing specification for mineral insulating oils, published on 26 June 2020 as the fifth version with a stability date of 2030, covering unused and offsite recycled oil and defining Type A and Type B categories with a stray gassing test developed jointly by CIGRE D1 and IEC TC 10.
- Nynas AB
- Ergon, Inc.
- Shell plc
- Exxon Mobil Corporation
- TotalEnergies SE
- Petroliam Nasional Berhad
- China Petroleum & Chemical Corporation
- PetroChina Company Limited
- Idemitsu Kosan Co., Ltd.
- Cargill, Incorporated
- Hitachi Energy Ltd
- Dow Inc.
- Calumet, Inc.
- Apar Industries Limited
- Savita Oil Technologies Limited
- Gandhar Oil Refinery (India) Limited
- Hyrax Oil Sdn. Bhd
Expert perspectives
Demand in this market is governed by the installed fleet rather than by new construction, and the replacement and top-up volume consumed by transformers already in service is both larger and steadier than first fill. Age profile is doing most of the work, since units commissioned during the decades of fastest network expansion are reaching the end of their design life together and each one generates either a first fill for a replacement or a reclamation or retrofill for a life extension. Capital constraint pushes a growing share of those decisions toward life extension, which is why recycled oil grows at 10.4% against 6.6% for unused oil.
Value growth runs ahead of volume growth because the litres added are weighted toward ester fluids priced several times above mineral oil, so the average price per litre rises on mix rather than on mineral oil pricing, which continues to follow base oil and crude conditions. Natural esters reach a CAGR of 14.8% from a base of USD 431.5 million and remain a minority of litres throughout the forecast, so the fluid transition shows up in revenue well before it shows up in consumption.
Approval rather than price decides the ester business, because a fluid must be rated for the transformer design before it can be specified and the specification is settled when the transformer is ordered rather than when the oil is bought. Suppliers have moved their effort to the equipment makers and project developers accordingly, and a fluid approved on a widely built platform is worth more than a lower quotation. In mineral oil the equivalent asset is naphthenic base oil capacity, which a blender cannot replicate.
Spill prevention rules define oil to include vegetable oils, so an ester fill does not remove containment or planning obligations, and the ester case rests on fire performance, loading and asset life rather than on avoided compliance cost. Mineral oil supply carries the opposite exposure, concentrated in a small number of refineries where an outage moves regional availability and price. Reclamation positions stay regional because the freight on used oil consumes the margin, which leaves the segment open to national processors rather than to global suppliers. The age profile of the installed fleet is the largest swing factor in the forecast, since the pace at which owners choose replacement over life extension decides the split between first fill and reclamation volume.
Growth in this market rests on a transformer population that has to be maintained whatever happens to network investment, and it is paced by base oil availability, equipment approvals and the capital position of utilities. Suppliers holding base oil capacity or design approvals, and selling the testing alongside the fluid, will take a disproportionate share of the increase.
Customer perspectives
Condition of the solid insulation rather than condition of the fluid decides between replacement and life extension, and capital-constrained owners choosing extension are why recycled oil grows at 10.4% against 6.6% for unused oil and why reclamation has become a product business rather than a disposal route for the charge.
Fire separation distance at constrained sites supports the ester premium through avoided civil works, while spill prevention obligations continue to apply because the definition of oil reaches vegetable oils, which is why the ester case now rests on fire performance, loading and asset life rather than on avoided compliance cost.
Fluid selection taken at design stage by the developer rather than at procurement by an operator carries the first fill and the service volume for the life of the asset, which is why suppliers direct commercial effort at transformer makers and project developers, and why renewable generation grows at 9.4% as the fastest end user group in this market.
“We decide on the paper, not the oil, because the oil can be brought back to specification and the insulation cannot. If the paper has life left, we reclaim the charge and keep the unit, and that is a far cheaper year than a replacement.”
“Indoors the separation distance is what drives the civil cost, so the ester pays for itself in the wall we do not have to build. What it did not do is remove our containment, because the rules count vegetable oil as oil just the same.”
“The fluid is settled when we specify the transformer, not when we buy oil, because the maker has to rate the design for it. Once that is fixed it carries for the life of the plant.”
Frequently asked questions
The market was valued at USD 3.42 billion in 2025 and USD 3.18 billion in 2024, and is estimated at USD 3.72 billion in 2026.
Cite this report
Meticulous Research. (2026). Transformer Oil Market - Global Opportunity Analysis and Industry Forecast (2026-2036) (Report No. MREP - 1042467). Meticulous Market Research Pvt. Ltd. https://www.meticulousresearch.com/product/transformer-oil-market-7150