Fuel Gas System Market (2026-2036)
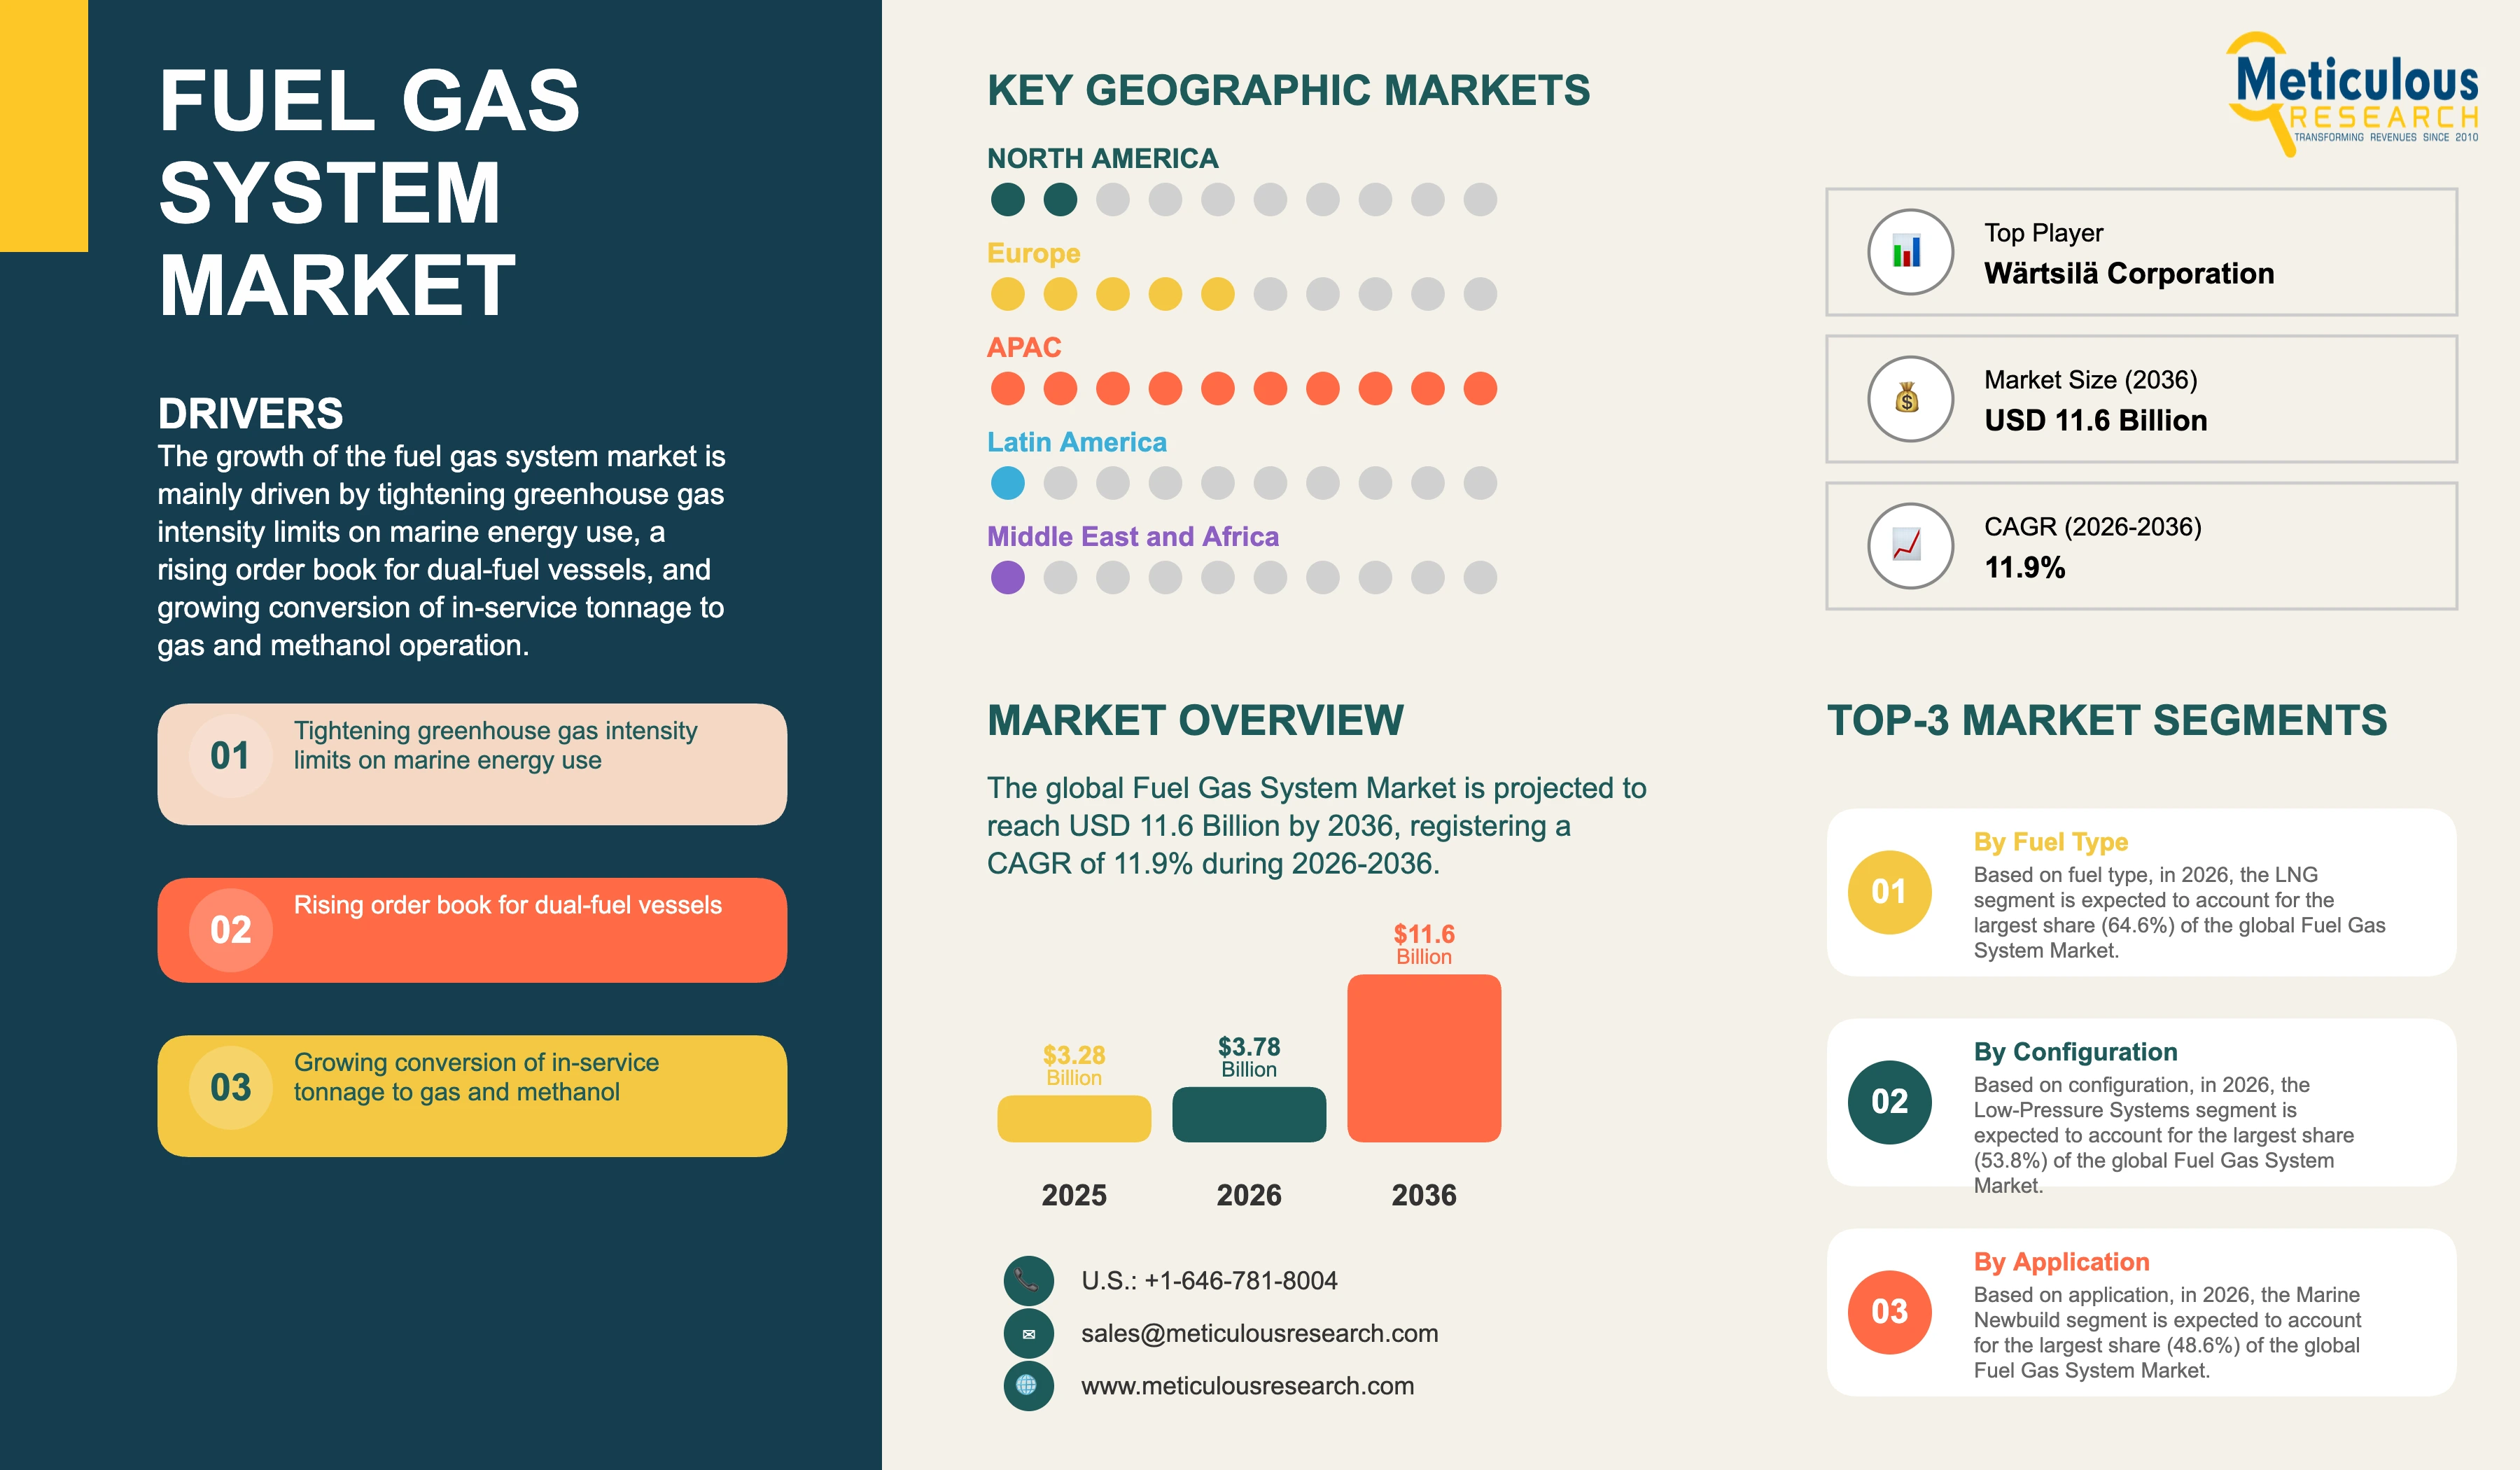
The global fuel gas system market was valued at USD 3.28 billion in 2025. This market is expected to reach USD 11.60 billion by 2036 from an estimated USD 3.78 billion in 2026, registering a CAGR of 11.9% during the forecast period (2026-2036).
- Published
- Nov 2026
- Pages
- 295
- Format
- PDF + Excel
- Report ID
- MREP - 1042464
- Base year
- 2025
- 2025 · BASELINE
- $3.28B
- 2036
- $11.60B
- CAGR 2026–2036
- 11.9%
2025 baseline · 2026–2036 forecast at 11.9% CAGR · hover a bar for the value
Key highlights
FuelEU Maritime applies in full from 1 January 2025 and sets greenhouse gas intensity limits starting at a 2% decrease in 2025 and reaching up to 80% by 2050.
The FuelEU Maritime limits cover ships above 5, 000 gross tonnage calling at European ports regardless of flag, which defines the addressable fleet for conversion.
Onshore power supply becomes mandatory for passenger and container ships at berth from 1 January 2030 in designated ports and from 1 January 2035 in all European ports with the capacity.
The IGF Code is written on a goal-based approach, and its equivalence goal refers specifically to natural gas, so methanol and ammonia systems are approved project by project.
Baker Hughes completed the acquisition of Chart Industries on 16 July 2026 and reports it as a third operating segment, consolidating cryogenic equipment under a single owner.
Marine retrofit is the fastest-growing application at a CAGR of 19.8%, against 10.3% for marine newbuild.
Ammonia is the fastest-growing fuel type at a CAGR of 26.4% from a base of USD 234.4 million in 2026.
The average selling price rises from USD 2.86 million per system in 2026 to USD 3.65 million by 2036 as containment and safety content increases.
By fuel type, LNG accounts for the largest share of 64.6% in 2026, while ammonia registers the highest CAGR.
By configuration, low-pressure systems account for the largest share of 53.8%, while high-pressure systems register the higher CAGR of 13.0%.
By component, pumps and compressors account for the largest share of 28.6%, while control and safety systems register the highest CAGR of 14.4%.
By application, marine newbuild accounts for the largest share of 48.6%, while marine retrofit registers the highest CAGR.
By geography, Asia-Pacific accounts for the largest share of 52.4% in 2026, while Europe registers the highest CAGR of 13.2%.
Report summary
| Particulars | Details |
|---|---|
| Forecast Period | 2026-2036 |
| Base Year | 2025 |
| Estimated Year | 2026 |
| CAGR (2026-2036) | 11.9% by value and 9.2% by volume |
| Format | PDF, Excel & Cloud Portal · 295 pages |
| Market Size in 2025 | USD 3.28 billion (1,180 systems) |
| Market Size in 2026 | USD 3.78 billion (1,320 systems) |
| Market Size by 2036 | USD 11.60 billion (3,180 systems) |
| Segments Covered | Fuel Type, Configuration, Component, Application, Geography |
| Countries Covered | U.S., Canada, Germany, Norway, Denmark, Greece, Italy, Netherlands, France, Finland, Rest of Europe, China, South Korea, Japan, Singapore, India, Australia, Rest of Asia-Pacific, Brazil, Mexico, Rest of Latin America, Saudi Arabia, Qatar, U.A.E., South Africa, Rest of Middle East & Africa |
| Companies Profiled | 17 companies and other companies |
| Average Selling Price | USD 2.86 million per system in 2026 to USD 3.65 million by 2036 |
| Largest Segment by Fuel Type (2026) | LNG (64.6%) |
| Fastest-Growing Segment by Fuel Type | Ammonia (CAGR 26.4%) |
| Largest Region (2026) | Asia-Pacific (52.4%) |
| Fastest-Growing Region | Europe (CAGR 13.2%) |
Report overview
Segments covered: fuel type, configuration, component, application.
The growth of this market is mainly driven by the tightening of greenhouse gas intensity limits on energy used on board ships calling at European ports, the rising order book for dual-fuel vessels across container, car carrier and tanker segments, the growing conversion of in-service tonnage to gas and methanol operation, and the expanding use of gas as a primary fuel in distributed power generation and industrial heat. However, factors such as the goal-based treatment of fuels other than natural gas in the governing safety code, the shortage of bunkering infrastructure for methanol and ammonia outside a small number of ports, the engineering lead times imposed by project-specific approval of alternative fuel systems, and the capital cost of a fuel gas system relative to a conventional oil fuel installation are expected to restrain the growth of this market to some extent.
In volume terms, deliveries are expected to reach 3,180 systems by 2036 from an estimated 1,320 systems in 2026 and 1,180 systems in 2025, registering a CAGR of 9.2% during the forecast period, with the average selling price rising from USD 2.86 million to USD 3.65 million per system as methanol and ammonia installations with higher engineering and containment content take a larger share of deliveries.
Value grows faster than volume because the mix moves toward larger high-pressure installations and toward fuels whose systems carry additional containment, inerting and gas detection content, so the price per system rises while the number of systems delivered grows more slowly.
A fuel gas system stores, conditions and delivers a low-flashpoint fuel to an engine or turbine at the pressure, temperature and purity the prime mover requires, and the content of the scope runs from the tank and containment through pumps, compressors, vaporisers and heat exchangers to the valve train, gas detection and control equipment. Demand is set by what owners are required to burn rather than by what they would choose, and the regulatory limits on the carbon intensity of marine energy have become the primary driver of the order book.
Regulation (EU) 2023/1805 on the use of renewable and low-carbon fuels in maritime transport and amending Directive 2009/16/EC, dated 13 September 2023, known as FuelEU Maritime, which applies in full from 1 January 2025 with the monitoring plan provisions of Articles 8 and 9 applying from August 2024 sets maximum limits on the yearly average greenhouse gas intensity of the energy used on board, starting at a 2% decrease in 2025 and reaching up to an 80% reduction by 2050, for ships above 5,000 gross tonnage calling at European ports regardless of flag, and requires passenger and container ships at berth to use onshore power supply or alternative zero-emission technologies from 1 January 2030 in ports covered by Article 9 of the alternative fuels infrastructure regulation and from 1 January 2035 in all European ports that develop onshore power capacity. A 2% reduction in 2025 is reachable with operational measures and a small share of alternative fuel, while the later steps cannot be met without a substantial volume of low-carbon fuel burned on board, which places the heavy conversion demand in the second half of the forecast period rather than at its start. Owners are ordering dual-fuel capability now and deferring the fuel decision, because a fuel gas system installed today can be supplied with a fuel chosen later.
the International Code of Safety for Ships Using Gases or Other Low-flashpoint Fuels, known as the IGF Code, which provides mandatory criteria for the arrangement and installation of machinery, equipment and systems using gases or low-flashpoint liquids as fuel, excludes vessels covered by the IGC Code, and is written on a goal-based approach with goals and functional requirements set for each section, and the equivalence goal of the IGF Code refers specifically to natural gas, and the International Maritime Organization reviews the Code periodically because fuel technology is changing rapidly. Natural gas systems therefore follow a prescriptive route with established approval precedent, while methanol and ammonia installations are approved through the goal-based route as alternative designs assessed case by case. Engineering content per system is higher for those fuels, lead times are longer, and the work concentrates among a small number of suppliers that have completed approvals with the classification societies and flag administrations involved.
Gas carriers sit outside this market in regulatory terms because vessels covered by the IGC Code are excluded from the IGF Code, and their cargo handling and fuel arrangements are designed under a separate rule set. The distinction matters commercially because the suppliers of cargo handling systems to gas carriers are largely the same companies that supply fuel gas systems to dual-fuel vessels, and capacity is shared between the two order books.
Retrofit economics differ from newbuild economics in every respect that determines a purchase. A conversion is constrained by the space and structure of an existing vessel, performed in a yard window measured in weeks, and justified against a compliance cost the owner already faces rather than against the capital cost of a new ship. Engineering is bespoke to each vessel, the price per system is higher than the equivalent newbuild scope, and the segment grows faster than newbuild because the deadline applies to the fleet in service and not only to vessels on order.
LNG bunkering is established at a wide set of ports and supports deep-sea trades, methanol is available at a growing but limited number of locations, and ammonia bunkering remains confined to pilot arrangements. Owners on fixed routes can commit to a fuel that is available at both ends of the trade, while owners in tramp trades specify systems that tolerate more than one fuel, which raises system cost and favours suppliers able to deliver multi-fuel capability, so bunkering availability rather than engine capability decides which fuels can be specified in practice.
Supply concentrates among engine builders, cryogenic equipment specialists and the large shipbuilding groups that build the systems into their own hulls. The engine builder holds the interface specification for the gas supply, which gives it influence over the system scope regardless of who supplies the equipment, and the shipyards in Korea, China and Japan capture the newbuild work by proximity to the hull. Independent specialists win the retrofit scope and the complex alternative fuel projects where approval experience rather than fabrication capacity decides the award.
Asia-Pacific, with a 52.4% share in 2026 valued at USD 1,980.8 million, at a CAGR of 11.8%.
Europe, at a CAGR of 13.2%, valued at USD 1,013.0 million in 2026.
Europe accounts for 26.8% of the market in 2026, valued at USD 1,013.0 million, and registers the highest CAGR of 13.2%, led by owners in Greece, Norway, Denmark, Germany and Italy and by conversion work in regional yards.
The Middle East & Africa accounts for 5.6% in 2026, valued at USD 211.7 million, at a CAGR of 10.8%, and Latin America for 2.8%, valued at USD 105.8 million, at a CAGR of 10.0%.
The report profiles 17 companies, including Wärtsilä Corporation, MAN Energy Solutions SE, HD Hyundai Co., Ltd., Samsung Heavy Industries Co., Ltd., Hanwha Ocean Co., Ltd. and Alfa Laval AB. The top five players account for an estimated 42.6% of the market in 2026.
LNG, with a 64.6% share in 2026 valued at USD 2,441.9 million.
Low-pressure systems, with a 53.8% share in 2026 valued at USD 2,033.6 million.
High-pressure systems, at a CAGR of 13.0%, valued at USD 1,746.4 million in 2026.
Pumps and compressors, with a 28.6% share in 2026 valued at USD 1,081.1 million.
Control and safety systems, at a CAGR of 14.4%, valued at USD 491.4 million in 2026.
Report infographic
Market dynamics
15 factors across 5 forcesTightening greenhouse gas intensity limits on marine energy use
Maximum limits on the yearly average greenhouse gas intensity of energy used on board apply to ships above 5,000 gross tonnage calling at European ports regardless of flag, beginning at a 2% decrease in 2025 and reaching up to 80% by 2050. An owner facing a limit it cannot meet with operational measures must change the fuel burned, and changing the fuel requires the storage, conditioning and delivery equipment that constitutes this market. The requirement applies by port call rather than by flag, so a vessel trading into Europe from anywhere carries the same obligation as a European-flagged ship.
Compliance is assessed annually, which turns the limit into a recurring cost rather than a single event and makes the installation of a fuel gas system a way of avoiding an expense that repeats every year of the remaining vessel life. Owners with long-lived tonnage and fixed European trades reach the investment decision first on that basis, and the order pattern follows trade route rather than vessel type.
Rising order book for dual-fuel vessels across container, car carrier and tanker segments
Dual-fuel capability has become a standard specification rather than an option on new container ships, car carriers and product tankers, because a vessel ordered today will trade for decades under limits that tighten throughout its life and a conventional oil fuel installation cannot be made compliant later without a conversion. Ordering the capability at the newbuild stage costs a fraction of retrofitting it, and the premium is small against the total cost of the vessel. Charterers have reinforced the pattern by preferring tonnage that can demonstrate a compliance path.
Owners install the system and then supply it with whichever compliant fuel is available and economic at the time, which means demand for fuel gas systems runs ahead of demand for any particular fuel. Suppliers able to deliver a system that handles more than one fuel capture a premium for that flexibility, and the fuel decision has separated from the equipment decision altogether.
Growing conversion of in-service tonnage to gas and methanol operation
The fleet in service is far larger than the order book and carries the same obligations in the same trades, so the compliance requirement reaches vessels that were never designed for a low-flashpoint fuel. Conversion projects fit tanks, containment and a complete gas supply train into an existing hull during a yard window, and the engineering is specific to each vessel rather than repeatable across a class. Demand is concentrated in tonnage with sufficient remaining life to recover the investment and in trades where the compliance cost is highest.
A vessel must be taken out of service, the work must coincide with a scheduled docking to avoid a second off-hire period, and the yards able to perform gas system installation are a subset of those performing routine repair, so yard capacity rather than equipment supply constrains the pace of conversion. Retrofit therefore grows at nearly twice the rate of newbuild while remaining the smaller share of the market throughout the forecast.
Expanding use of gas as a primary fuel in distributed power generation and industrial heat
Gas-fired reciprocating engines and small turbines supplying industrial sites, islands, mining operations and data centre campuses require fuel conditioning equipment of the same kind used at sea, covering filtration, pressure regulation, heating and metering before the prime mover. Demand follows new gas-fired capacity and the conversion of liquid fuel installations, and in locations without pipeline supply it extends to regasification and storage as part of the same scope. Projects are smaller than marine installations individually but numerous, and they are repeatable in a way that marine conversions are not.
Backup and bridging generation for large electrical loads has added to this demand. Where grid connection timelines exceed the schedule of the load being served, gas-fired generation is installed as a primary or bridging supply, and the fuel conditioning scope travels with it. This is the fastest-moving source of new enquiry in the non-marine part of the market.
Table of contents
12 chapters · 135 sections · 295 pages · click to expandSegmental analysis
| Segment | Largest share (2026) | Fastest growth (2026–2036) |
|---|---|---|
| By Fuel Type | LNG | Rapid growth of this |
| By Configuration | Low-pressure | — |
| By Component | Pumps and compressors | Rapid growth of this |
| By Application | Marine newbuild | Rapid growth of this |
By Fuel Type
- The LNG segment is expected to account for the largest share of 64.6% of the global fuel gas system market, valued at USD 2,441.9 million, with deliveries split between newbuild dual-fuel tonnage and a growing conversion volume.
- The large share of this segment is mainly due to an established prescriptive approval route under the governing safety code, bunkering availability at a wide set of ports that supports deep-sea trades, and a delivered base of dual-fuel engines sized for gas operation.
- Methanol accounts for 16.8%, valued at USD 635.0 million, growing at a CAGR of 18.6%, supported by ambient-temperature handling that removes cryogenic containment from the system scope and lowers the weight and space the installation occupies, which matters most in a conversion.
- LPG and ethane account for 9.4%, valued at USD 355.3 million, concentrated in tonnage that carries the same product as cargo.
- However, the ammonia segment, valued at USD 234.4 million in 2026 and accounting for a share of 6.2%, is projected to register the highest CAGR of 26.4% during the forecast period.
- The rapid growth of this segment is attributed to the absence of carbon in the fuel, which positions it for the later intensity reduction steps that cannot be met with gas alone, and to a base small enough that a handful of vessel programmes moves the segment.
- Hydrogen and other fuels account for 3.0%, valued at USD 113.4 million, largely in short-sea and demonstration tonnage where the route is short enough for the storage volume to be workable.
- Fuel selection across the whole segmentation follows bunkering availability at both ends of a trade rather than the relative merits of the fuels, which is why fixed-route tonnage leads adoption of methanol and tramp tonnage specifies systems that tolerate more than one fuel.
- Ammonia, at a CAGR of 26.4%, valued at USD 234.4 million in 2026, ahead of methanol at 18.6%.
By Configuration
- Fuel Gas System Analysis by Configuration
- The low-pressure segment is expected to account for the largest share of 53.8% of the market, valued at USD 2,033.6 million.
- The large share of this segment is mainly due to its use with dual-fuel engines of the low-pressure type that dominate deliveries in container, car carrier and cruise tonnage, and to a simpler equipment scope that omits high-pressure pumps and the associated containment.
- High-pressure systems, valued at USD 1,746.4 million in 2026 and accounting for a share of 46.2%, grow at a CAGR of 13.0% against 11.0% for low-pressure systems.
- The faster growth of high-pressure systems is attributed to engine selections that favour high-pressure gas injection for efficiency and methane slip reasons in large tanker and bulk carrier tonnage, and to a higher equipment value per installation that raises the share of this configuration in value terms ahead of its share in units.
- Engine selection rather than owner preference settles this choice, because the gas supply pressure is fixed by the prime mover, and the shift in engine orders toward high-pressure injection is what carries the configuration mix.
By Component
- The pumps and compressors segment is expected to account for the largest share of 28.6% of the market, valued at USD 1,081.1 million.
- The large share of this segment is mainly due to the pressure duty in every system regardless of fuel, and to the concentration of value in cryogenic pumps and reciprocating compressors qualified for gas service.
- Heat exchangers and vaporisers account for 22.4%, valued at USD 846.7 million, and tanks and containment for 19.8%, valued at USD 748.4 million, the latter growing at a CAGR of 12.2% as insulated and double-walled arrangements take a larger share.
- Valves, piping and fittings account for 16.2%, valued at USD 612.4 million.
- However, the control and safety systems segment, valued at USD 491.4 million in 2026 and accounting for a share of 13.0%, is projected to register the highest CAGR of 14.4% during the forecast period.
- The rapid growth of this segment is attributed to gas detection, inerting, ventilation and shutdown functions that scale with the hazard rather than with the size of the installation, and to alternative design assessments that resolve into additional monitoring and safeguarding rather than into different mechanical equipment.
- Containment value also rises with the move to methanol and ammonia, where double-walled piping and inerted spaces are required over a greater extent of the system than a comparable gas installation.
By Application
- The marine newbuild segment is expected to account for the largest share of 48.6% of the market, valued at USD 1,837.1 million, growing at a CAGR of 10.3%.
- The large share of this segment is mainly due to dual-fuel capability having become a standard specification on new container ships, car carriers and product tankers, and to the cost of installing the capability at the building stage being a fraction of the cost of adding it later.
- Power generation accounts for 18.4%, valued at USD 695.5 million, growing at a CAGR of 11.4% on distributed and bridging gas-fired capacity.
- Oil and gas applications account for 12.6%, valued at USD 476.3 million, in offshore and onshore processing duty.
- However, the marine retrofit segment, valued at USD 536.8 million in 2026 and accounting for a share of 14.2%, is projected to register the highest CAGR of 19.8% during the forecast period.
- The rapid growth of this segment is attributed to intensity limits that apply to the fleet in service and not only to vessels on order, to bespoke engineering and harder installation conditions that raise the price per system above the newbuild equivalent, and to standardised conversion packages for sister vessels that compress cost and schedule once the first ship of a series is complete.
- Industrial applications account for 6.2%, valued at USD 234.3 million, in process heat and captive generation at sites converting from liquid fuel.
- The split between newbuild and retrofit also determines where the value is recognised geographically, with newbuild scope captured at the Asian yards that build the hull and conversion scope captured in the regions where the vessel docks, so the regional value split in this market follows yard and docking location rather than where the vessels are owned or where the compliance obligation falls.
- Marine newbuild, with a 48.6% share in 2026 valued at USD 1,837.1 million, at a CAGR of 10.3%.
- Marine retrofit, at a CAGR of 19.8%, valued at USD 536.8 million in 2026.
Geographic analysis
Asia-Pacific
Largest shareIn 2026, Asia-Pacific is expected to account for the largest share of 52.4% of the global fuel gas system market, valued at USD 1,980.8 million, growing at a CAGR of 11.8% during the forecast period. The large share of this region is mainly due to the concentration of newbuild shipbuilding in South Korea, China and Japan, where the system is built into the hull and the value is recognised at the yard rather than at the owner. South Korea carries the largest share of gas-fuelled and gas-carrying newbuild work, China the fastest-growing yard capacity across vessel types, and Japan a deep component base in compressors, pumps and heat exchangers that supplies the region and exports beyond it. Singapore contributes bunkering and conversion activity rather than newbuild construction, and it anchors the regional retrofit demand.
Europe
Fastest growthEurope accounts for 26.8% of the market in 2026, valued at USD 1,013.0 million, and is projected to register the highest CAGR of 13.2% during the forecast period. Growth is led by the intensity limits that apply to ships calling at European ports regardless of flag, which fall on owners concentrated in Greece, Norway, Denmark, Germany and Italy, and by the conversion work those limits generate in regional yards. The region also hosts the engineering organisations and classification societies that lead alternative design assessments, which keeps the methanol and ammonia project work there even where the hull is built elsewhere.
North America
North America accounts for 12.4% of the market in 2026, valued at USD 468.7 million, at a CAGR of 10.6%. Demand is led by the United States across Jones Act tonnage, offshore support vessels and gas-fired distributed generation, with the non-marine share of the market higher than in any other region. Canada contributes a smaller base weighted toward ferry operations and remote power generation where gas displaces diesel delivered by road, and where the conversion case rests on fuel cost rather than on an emissions obligation.
Middle East & Africa
The Middle East & Africa accounts for 5.6% of the market in 2026, valued at USD 211.7 million, at a CAGR of 10.8%, concentrated in Saudi Arabia, Qatar and the United Arab Emirates where gas is abundant and new industrial and power capacity is specified for gas firing from the outset.
Latin America
Latin America accounts for 2.8%, valued at USD 105.8 million, at a CAGR of 10.0%, with Brazil and Mexico carrying most of the activity on offshore support tonnage and on regasification-linked power generation.
Competitive landscape
Engine builders, cryogenic equipment specialists and the large shipbuilding groups divide this market between them, and the engine builder holds a structural advantage because it owns the interface specification that the gas supply must satisfy. A system supplied by a third party is still designed to the pressure, temperature and purity conditions the engine maker sets, which gives the engine maker influence over the scope and a credible route to supplying it directly. Shipbuilding groups in Korea, China and Japan capture newbuild work through proximity to the hull and in-house fabrication.
Independent specialists compete on approval experience rather than on fabrication capacity, because methanol and ammonia installations are assessed as alternative designs and the evidence from a completed project is what shortens the next one. That has concentrated alternative fuel work among a small number of suppliers and made the record of completed approvals the commercially decisive credential. The same suppliers dominate retrofit, where bespoke engineering within an existing hull rewards experience over capacity.
Baker Hughes completed the acquisition of Chart Industries on 16 July 2026 and reports it as a third operating segment, which places a broad cryogenic portfolio inside a diversified industrial group, and because that acquisition makes Chart part of Baker Hughes it is not listed separately in this report. Buyers now negotiate with fewer independent suppliers able to quote a complete cryogenic scope, and the ability to bid equipment and rotating machinery together has become a differentiator in large projects, particularly where an owner is buying for a series of vessels rather than for one hull. Pricing power in those awards has moved toward the suppliers that hold both scopes.
Some of the key players operating in the fuel gas system market are Wärtsilä Corporation, MAN Energy Solutions SE, HD Hyundai Co., Ltd., Samsung Heavy Industries Co., Ltd., Hanwha Ocean Co., Ltd., Mitsubishi Heavy Industries, Ltd., Kawasaki Heavy Industries, Ltd., Alfa Laval AB, Linde plc, Nikkiso Co., Ltd., Burckhardt Compression Holding AG, Babcock International Group PLC, TGE Marine Gas Engineering GmbH, Gaztransport & Technigaz SA, Kongsberg Gruppen ASA, Baker Hughes Company, and Siemens Energy AG, among others.
- —
Baker Hughes completed the acquisition of Chart Industries on 16 July 2026 and reports it as a third operating segment. FuelEU Maritime has applied in full since 1 January 2025, with onshore power supply requirements for passenger and container ships at berth from 1 January 2030 in designated ports.
- Wärtsilä Corporation
- MAN Energy Solutions SE
- HD Hyundai Co., Ltd.
- Samsung Heavy Industries Co., Ltd.
- Hanwha Ocean Co., Ltd.
- Mitsubishi Heavy Industries, Ltd.
- Kawasaki Heavy Industries, Ltd.
- Alfa Laval AB
- Linde plc
- Nikkiso Co., Ltd.
- Burckhardt Compression Holding AG
- Babcock International Group PLC
- TGE Marine Gas Engineering GmbH
- Gaztransport & Technigaz SA
- Kongsberg Gruppen ASA
- Baker Hughes Company
- Siemens Energy AG
Expert perspectives
Demand in this market is created by regulation rather than by preference, and the intensity limits that apply to ships calling at European ports have replaced fuel price as the reason an owner buys a fuel gas system. Compliance is assessed every year, so the limit behaves as a recurring cost across the remaining life of a vessel, and the investment is weighed against that stream rather than against a fuel saving. What governs the pace of orders is the approval route available for each fuel, since a system whose approval basis is established carries a known cost and schedule while an alternative design assessment carries neither.
Spending follows the equipment that resolves the compliance question at the lowest schedule risk, which keeps LNG in the majority of deliveries through the forecast period even where ammonia would better serve the position after 2040. Control and safety content grows faster than mechanical content because alternative design assessments resolve into additional monitoring and safeguarding, and retrofit grows faster than newbuild because the limits reach the fleet in service and not only the order book.
Approval experience rather than fabrication capacity is what a supplier competes on in the fastest-growing parts of this market. Evidence from a completed methanol or ammonia project shortens the next assessment materially, and the engineering organisations able to lead such assessments are few, so early project wins compound into a position that capacity alone cannot buy. Suppliers without that record compete in LNG newbuild work, where the route is prescriptive and the yards hold the advantage.
The ammonia growth rate of 26.4% compounds from a base of USD 234.4 million, so the segment stays a small part of the market throughout the forecast and a handful of vessel programmes moves it more than any shift in sentiment. Marine retrofit grows at nearly twice the newbuild rate while remaining the smaller share, and the constraint on it is yard capacity and docking schedules rather than equipment availability. Average selling price rises across the forecast because containment and safety content increases, which means value growth overstates the growth in the number of installations. Bunkering availability for methanol and ammonia is the largest swing factor, and a faster build-out would move the fuel mix more than any change in the cost of the equipment.
Growth in this market rests on an obligation owners cannot avoid in the trades they serve, and it is paced by approval routes and yard windows rather than by demand. Suppliers that hold completed approvals and can install inside a scheduled docking will take a disproportionate share of the increase.
Customer perspectives
Fleet Director - container shipping owner, Europe
The intensity limit is checked every year for as long as we trade into Europe, so we are not comparing a fuel price, we are buying our way out of a cost that repeats. We order the system now and decide the fuel later, because the equipment is the long lead item.
Annual assessment turns the limit into a recurring cost across the remaining life of a vessel, which is why demand for fuel gas systems runs ahead of demand for any individual fuel and why dual-fuel capability has become a standard newbuild specification across container, car carrier and product tanker tonnage.
Technical Manager - product tanker operator, Asia-Pacific
We looked at ammonia and the approval work alone would have pushed our delivery by two quarters, so we took gas. The chemistry was never the issue, the schedule was.
Alternative design assessment of fuels other than natural gas adds months to a vessel programme, which is why LNG retains 64.6% of deliveries in 2026 and why ammonia grows from a base of USD 234.4 million rather than from volume. Schedule risk rather than capital cost settles the fuel choice for owners working to a fixed delivery date.
Head of Newbuilding and Conversions - car carrier operator, Europe
Our conversion had to fit a docking we had already booked, and the first ship of the series took the engineering. The second and third were far cheaper because the approval evidence carried across.
Yard windows and docking schedules rather than equipment supply set the pace of conversion, and standardised packages for sister vessels compress cost and schedule once the first ship of a series is complete, which is the basis of the 19.8% growth in marine retrofit against 10.3% for newbuild and of the higher price per system in conversion work.
Frequently asked questions
The market was valued at USD 3.28 billion in 2025 and USD 2.86 billion in 2024, and is estimated at USD 3.78 billion in 2026.
Cite this report
Meticulous Research. (2026). Fuel Gas System Market - Global Opportunity Analysis and Industry Forecast (2026-2036) (Report No. MREP - 1042464). Meticulous Market Research Pvt. Ltd. https://www.meticulousresearch.com/product/fuel-gas-system-market-7147