Truckload and Less-than-Truckload (LTL) Freight Services Market (2026-2036)
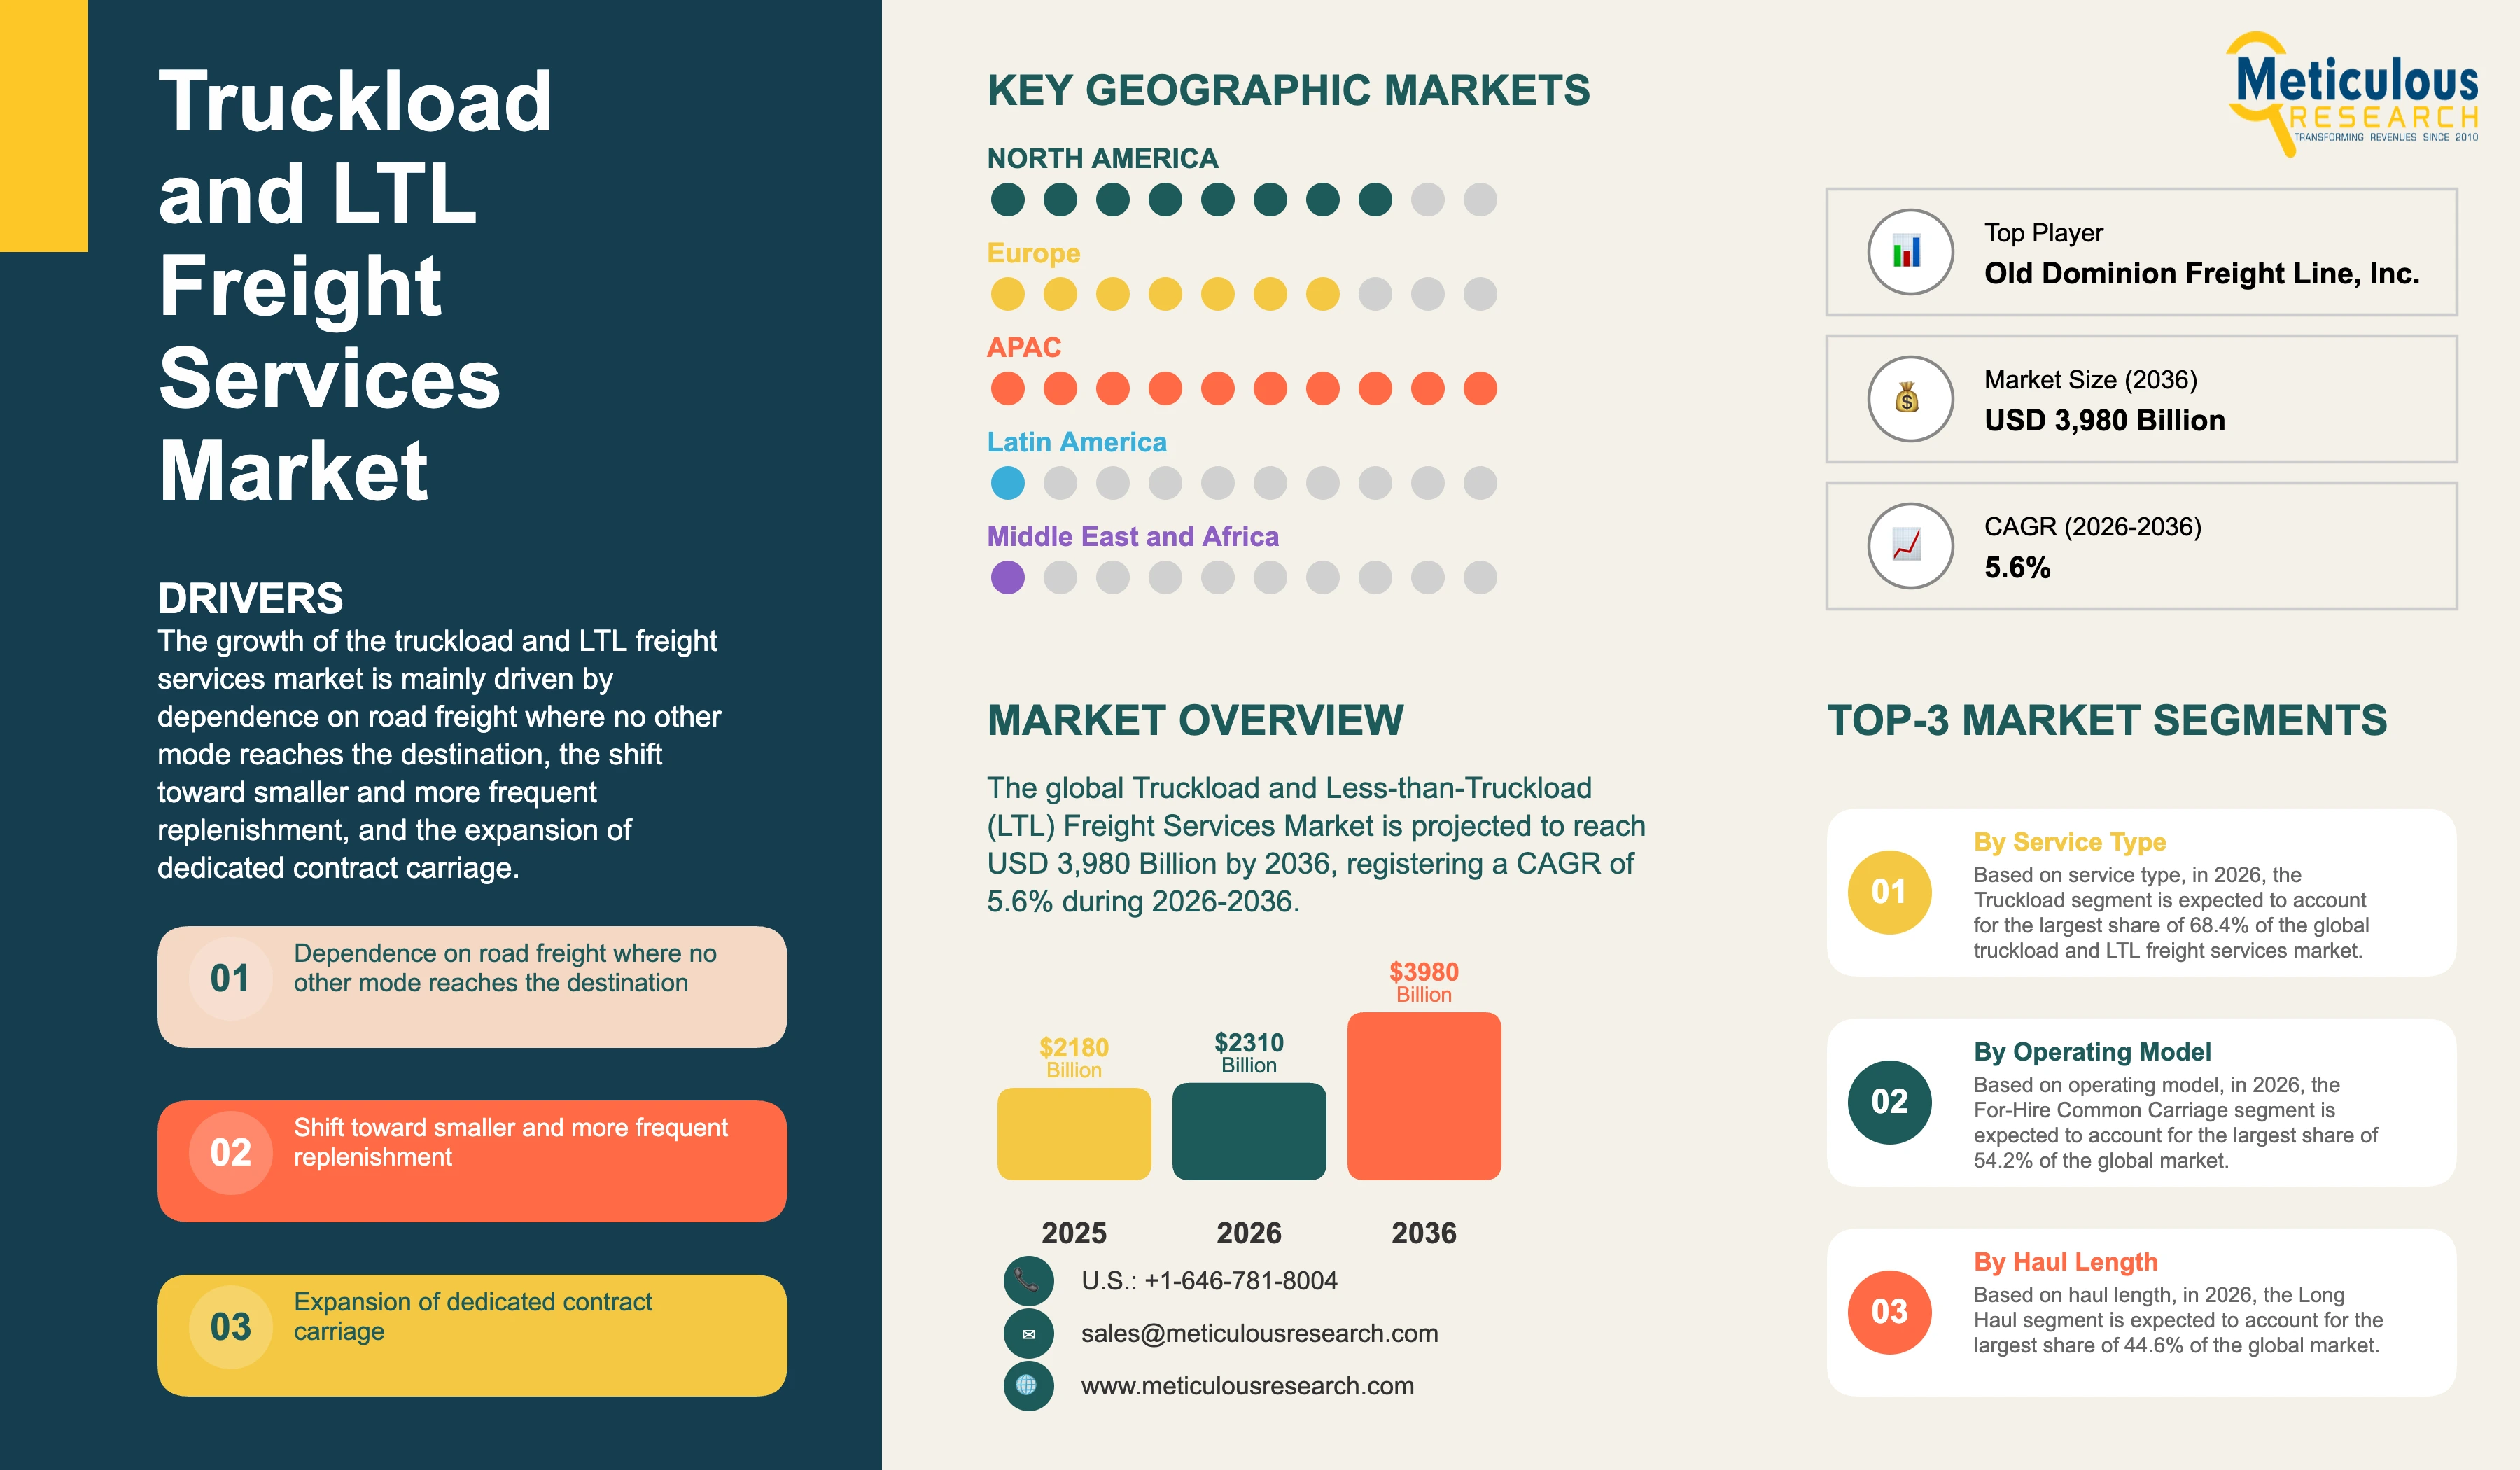
The global truckload and less-than-truckload (LTL) freight services market was valued at USD 2,180.00 billion in 2025. This market is expected to reach USD 3,980.00 billion by 2036 from an estimated USD 2,310.00 billion in 2026, registering a CAGR of 5.6% during the forecast period (2026-2036).
- Published
- Nov 2026
- Pages
- 265
- Format
- PDF + Excel
- Report ID
- MRAUTO - 1042550
- Base year
- 2025
- 2025 · BASELINE
- $2.18T
- 2036
- $3.98T
- CAGR 2026–2036
- 5.6%
2025 baseline · 2026–2036 forecast at 5.6% CAGR · hover a bar for the value
Key highlights
The global truckload and LTL freight services market is estimated at USD 2, 310.00 billion in 2026 and is projected to reach USD 3,980.00 billion by 2036.
Truckload services are expected to account for the largest share of 68.4% in 2026, while less-than-truckload is projected to register the highest CAGR of 6.8%.
For-hire common carriage is expected to hold the largest operating model share of 54.2% in 2026, while dedicated contract carriage is projected to grow fastest at a CAGR of 7.4%.
Long haul movements are expected to be the largest haul length with a share of 44.6% in 2026, while regional movements are projected to register the highest CAGR of 6.6%.
Retail and consumer goods is expected to be the largest end user with a share of 22.4% in 2026, while food and beverage is projected to grow fastest at a CAGR of 6.5%.
Asia-Pacific is expected to hold the largest share of 36.8% in 2026, and it is also the fastest-growing region at a CAGR of 7.2%.
FedEx Freight Holding Company, Inc. began trading on the New York Stock Exchange as a separate company on 1 June 2026 following its spin-off from FedEx Corporation.
The 18 companies profiled accounted for 7.6% of the market in 2025, which reflects how fragmented road freight capacity remains.
Regulation (EU) 2024/1610 requires new heavy-duty vehicles to cut carbon dioxide emissions by 45% from 2030, 65% from 2035 and 90% from 2040.
The exit of a major United States less-than-truckload carrier in July 2023 removed terminal capacity that competitors took years to replace.
Report summary
| Particulars | Details |
|---|---|
| Base Year | 2025 |
| Estimated Year | 2026 |
| Forecast Period | 2026-2036 |
| Market Size in 2025 | USD 2,180.00 billion |
| Estimated Market Size in 2026 | USD 2,310.00 billion |
| Projected Market Size by 2036 | USD 3,980.00 billion |
| CAGR (2026-2036) | 5.6% |
| Format | PDF, Excel & Cloud Portal · 265 pages |
| Measurement Basis | Freight charges paid by shippers for truckload and less-than-truckload movements, including freight sold by non-asset providers |
| Segments Covered | Service Type, Operating Model, Haul Length, End User, and Geography |
| Service Types Covered | Truckload (Dry Van, Refrigerated, Flatbed and Specialized, and Tanker) and Less-than-Truckload |
| Operating Models Covered | For-Hire Common Carriage, Dedicated Contract Carriage, and Owner-Operator and Small Fleet Capacity |
| Haul Lengths Covered | Long Haul, Regional, and Short Haul and Local |
| End Users Covered | Retail and Consumer Goods, Manufacturing and Industrial, Food and Beverage, Construction and Building Materials, Automotive, Chemicals and Energy, and Other End Users |
| Geographies Covered | North America, Europe, Asia-Pacific, Latin America, and Middle East & Africa |
| Companies Profiled | 18 leading players |
Report overview
Segments covered: service type, operating model, haul length, end user.
The growth of this market is mainly driven by the volume of goods moved by road in economies where no alternative mode reaches the destination, the shift of retail inventory toward smaller and more frequent replenishment that raises shipment counts, the expansion of dedicated contract carriage as shippers seek committed capacity at agreed rates, and the terminal network constraint in less-than-truckload that supports pricing. However, factors such as the driver shortage that limits how much capacity carriers can operate, the ease of entry into truckload that keeps rates at the level of marginal cost, rising insurance and claims costs following large verdicts, and the capital required to meet tightening vehicle emission standards are expected to restrain the growth of this market to some extent.
Truckload services account for the largest share of this market because road freight at full vehicle loads carries the greatest volume of goods in every major economy. Less-than-truckload grows faster because it requires a terminal network that cannot be assembled quickly, which holds pricing through cycles in a way truckload pricing does not.
Truckload and less-than-truckload freight services cover the movement of goods by road for payment, measured as the freight charges shippers pay for those movements whether the service is sold by the carrier operating the vehicle or by a non-asset provider that arranges the capacity, with truckload describing a shipment that fills a vehicle and travels from one origin to one destination, and less-than-truckload describing shipments from several customers consolidated through a network of terminals. The distinction appears to be one of shipment size, and it is in commercial terms a difference in business model, because the two halves of this market are built on different assets and respond to demand changes in opposite directions.
Truckload has almost no barrier to entry beyond a vehicle, an operating authority and the minimum insurance a regulator requires. The consequence is a market of very large numbers of carriers offering a service that buyers cannot meaningfully distinguish between, so rates settle at the marginal cost of the least efficient operator still willing to haul the load. When freight demand rises, capacity enters within weeks because used tractors are available and drivers move between employers, and when demand falls, carriers exit and their equipment is resold rather than withdrawn. Pricing power therefore sits with whichever side of the market is short, and no individual carrier holds it for long.
Less-than-truckload operates on the opposite economics, because capacity in the segment is terminal capacity rather than vehicle capacity. A carrier consolidating shipments from many customers needs terminals within reach of the freight it collects, dock labour at each one and linehaul between them, and that network costs years and large sums to assemble. New entrants cannot replicate it, incumbents cannot extend it quickly, and capacity that leaves the market does not come back. The withdrawal of a major United States carrier in July 2023 demonstrated the point, because the terminals it vacated were bought and reopened over a period of years rather than months, and pricing in the segment held at levels that the preceding freight recession would ordinarily have eroded.
Driver availability sets the ceiling on how much capacity either half of the market can operate. The work requires nights away from home, a commercial licence, a medical certificate and compliance with daily and weekly driving limits recorded by electronic logging devices, and the pool of people willing to accept those conditions has not grown with freight volumes. Carriers compete for the same drivers rather than recruiting new ones into the occupation, which turns pay increases into cost inflation without adding capacity. Turnover at larger truckload carriers runs high enough that a substantial proportion of the workforce is replaced each year, and the recruitment and training cost of that churn sits in the operating ratio.
Insurance and claims have become a structural cost rather than a line item. Large jury awards in accident litigation have raised the cost of excess liability cover across the sector, and the minimum financial responsibility a federal regulator requires is now well below what shippers and brokers demand contractually. Smaller carriers face premiums that can exceed the margin on the freight they haul, which removes capacity at the lower end of the market and raises the effective cost of entry above the price of a truck. Shippers and brokers now treat safety performance as a qualification for the freight rather than only as a compliance matter, so a carrier with a deteriorating record loses access to work before any regulator acts.
Vehicle emission standards are moving fleet replacement onto a timetable set by regulation rather than by the condition of the equipment. Regulation (EU) 2024/1610, which amends Regulation (EU) 2019/1242, requires new heavy-duty vehicles sold in the European Union to cut carbon dioxide emissions by 45% from 2030, 65% from 2035 and 90% from 2040 against the applicable reference period, which commits carriers to fleet replacement on a timetable set by regulation rather than by vehicle condition. Zero-emission tractors cost more than diesel equivalents and need charging or refuelling infrastructure that does not yet exist along most long haul corridors, so the first vehicles are being deployed on regional and short haul work where they return to a depot each night.
A substantial proportion of truckload freight is sold to shippers by providers that own no vehicles, which arrange capacity from carriers and retain the difference between what the shipper pays and the carrier receives. Measured on shipper-paid freight charges, that freight sits within this market and those providers rank among its largest sellers, with C.H. Robinson Worldwide, Inc. selling more truckload freight by revenue than any carrier operating its own fleet. Reports measuring brokerage separately count the intermediation margin rather than the freight charge, so the two sit at different layers and do not overlap. Digital platforms have made it faster for a shipper to reach a carrier it has no relationship with, which has increased the proportion of truckload freight awarded outside contracted routing guides and sharpened the rate competition that fragmentation already creates.
Asia-Pacific, with a share of 36.8% in 2026 at USD 850.10 billion, with China growing at a CAGR of 7.5% and India at 8.9%.
Asia-Pacific, at a CAGR of 7.2%, which is also the largest region.
Europe holds a share of 24.2% in 2026 at USD 559.00 billion and is projected to grow at a CAGR of 4.2%, with Germany at 3.9%.
The Middle East & Africa holds 4.2% at USD 97.00 billion with a CAGR of 6.1%, and Latin America holds 5.4% at USD 124.70 billion with a CAGR of 5.8%, with Brazil at 6.0%.
The 18 companies profiled accounted for 7.6% of the market in 2025, and the top five players, Old Dominion Freight Line, Inc., FedEx Freight Holding Company, Inc., XPO, Inc., Knight-Swift Transportation Holdings Inc. and C.H. Robinson Worldwide, Inc., accounted for 4.4%.
Report infographic
Market dynamics
15 factors across 5 forcesDependence on Road Freight Where No Other Mode Reaches the Destination
Goods moving between a factory, a distribution centre and a retail location travel by road for at least part of the journey in every major economy, because rail reaches terminals rather than premises and ocean and air freight end at ports and airports. The volume of freight that must be moved by road therefore rises with industrial output and with consumption, and it does so without the substitution that affects other modes. Economies with limited rail freight capacity depend on road for movements that would travel by rail elsewhere, which raises road freight revenue relative to the size of the economy. This dependence is the reason demand in the truckload and LTL freight services market tracks economic activity closely and recovers with it rather than lagging a structural shift. Nearshoring has reinforced it, because production moved closer to consumption travels overland rather than by sea, which converts ocean freight into road freight on cross-border corridors and lengthens the average overland haul in the regions receiving that production.
Shift Toward Smaller and More Frequent Replenishment
Retailers and distributors holding less inventory at each location order smaller quantities more often, which converts shipments that once filled a vehicle into consignments that do not. The number of shipments rises faster than the tonnage moved, and each shipment carries its own pickup, handling and delivery cost, so revenue per tonne increases even where volumes are flat. Direct to consumer and store replenishment flows have accelerated the change, because both generate frequent deliveries into locations that cannot accept full vehicle loads. The shift moves freight from truckload into less-than-truckload networks, where the consolidation that makes small shipments viable is performed, and it is the principal reason the less-than-truckload segment is growing faster than truckload. The same pattern raises the number of stops per vehicle in regional work, which absorbs driver hours without adding distance and therefore tightens capacity further.
Expansion of Dedicated Contract Carriage
Shippers that cannot tolerate the rate volatility of the spot market are contracting committed capacity, under which a carrier assigns specified vehicles and drivers to one customer at agreed rates for a term of several years. The shipper gains predictable cost and service, and the carrier gains revenue that does not move with freight cycles, so both sides have reason to prefer the structure to open market tendering. Dedicated arrangements also absorb the driver recruitment burden that the shipper would otherwise carry if it operated its own fleet, which is why shippers winding down private fleets move into dedicated contracts rather than into common carriage. The model is the fastest-growing operating structure in this market and it carries better margins than spot truckload work. Contracts commonly run three to five years with fuel and wage adjustment built in, which removes from the carrier the two cost exposures that make open market truckload earnings unpredictable.
Terminal Network Constraint Supporting Less-than-Truckload Pricing
A less-than-truckload carrier can only serve freight within reach of its terminals, and building a terminal requires land near freight concentrations, dock doors, yard space and local labour that take years to assemble. Capacity in the segment therefore grows slowly and cannot respond to a demand increase in the way truckload capacity does, which allows carriers to hold rates when volumes recover. The economics also reward density, because a terminal handling more freight spreads its fixed cost across more shipments, so carriers with established networks earn more per shipment than new entrants could. This constraint is the reason revenue per shipment in the segment has risen through periods when truckload rates were falling. Carriers have also moved to pricing that reflects the space a shipment occupies rather than its declared freight class, which recovers cost on light and bulky consignments that the older basis underpriced.
Table of contents
12 chapters · 142 sections · 265 pages · click to expandSegmental analysis
By Service Type
- Truckload, with a share of 68.4% in 2026 at USD 1,580.00 billion.
- Less-than-truckload, at a CAGR of 6.8%, from USD 730.00 billion and a share of 31.6% in 2026.
- For-hire common carriage, with a share of 54.2% in 2026 at USD 1,252.00 billion.
- Dedicated contract carriage, at a CAGR of 7.4%, from USD 619.10 billion and a share of 26.8% in 2026.
- Long haul, with a share of 44.6% in 2026 at USD 1,030.30 billion.
- Regional, at a CAGR of 6.6%, from USD 836.20 billion and a share of 36.2% in 2026.
- Retail and consumer goods, with a share of 22.4% in 2026 at USD 517.40 billion.
- Food and beverage, at a CAGR of 6.5%, from USD 411.20 billion and a share of 17.8% in 2026.
Geographic analysis
Asia-Pacific
Largest shareIn 2026, Asia-Pacific is expected to account for the largest share of 36.8% of the global truckload and LTL freight services market, valued at USD 850.10 billion, and is also projected to register the highest CAGR of 7.2% during the forecast period. The region holds the largest share because road carries freight that would move by rail in other regions, with rail freight capacity in China and India committed largely to bulk commodities, and because the scale of manufacturing output moving to ports and to domestic consumption markets generates road freight revenue exceeding that of any other region. The rapid growth is attributed to domestic consumption expanding faster than in mature markets, to distribution networks extending into interior provinces and states that were previously served informally, and to the formalisation of road freight contracting, which brings revenue into the measured market that was not counted before. Freight that was carried by owner-operators outside any contract is increasingly moving onto platforms and into carrier accounts, which raises measured revenue without a corresponding increase in tonnage. Expressway construction has also brought interior locations within reach of a single day movement, which converts freight that previously travelled by rail or not at all into road haulage. China is projected to grow at a CAGR of 7.5% and India at 8.9%.
North America
North America follows with a share of 29.4% in 2026, valued at USD 679.20 billion, where revenue per mile is the highest of any region because distances are long, driver pay is high and insurance costs have risen sharply. The less-than-truckload segment is more consolidated here than elsewhere, and the pricing that held after a major carrier withdrew in July 2023 has sustained carrier margins through a weak truckload market. Canada adds cross-border movements that use the same carriers and the same driver pool, so capacity constraints in one country are felt in the other. The United States is projected to grow at a CAGR of 4.5%, with growth limited by the fragmentation of truckload capacity rather than by freight volumes, since rate recovery is competed away as capacity re-enters. Insurance cost increases have affected this region more than any other, which raises revenue per mile without improving carrier returns.
Latin America
Mexico sits within Latin America for the purposes of this report, and its cross-border freight into United States lanes is handled by carriers operating on both sides of the border under separate authorities.
Competitive landscape
The competitive structure of the truckload and LTL freight services market separates almost completely between its two halves. Less-than-truckload is led by a small number of carriers operating terminal networks, with Old Dominion Freight Line, Inc., FedEx Freight Holding Company, Inc., XPO, Inc., Saia, Inc., ArcBest Corporation, TFI International Inc. and Estes Express Lines, Inc. holding the greater part of the segment in North America. Truckload is contested by very large numbers of providers of which the largest, including C.H. Robinson Worldwide, Inc., Knight-Swift Transportation Holdings Inc., Landstar System, Inc., Schneider National, Inc., J.B. Hunt Transport Services, Inc., Werner Enterprises, Inc., RXO, Inc. and Loadsmart, Inc., each hold a small proportion of the segment, and they divide between carriers operating their own fleets, asset-light providers contracting owner-operator capacity and non-asset providers arranging it from the open market. Ryder System, Inc. competes principally in dedicated contract carriage.
The 18 companies profiled accounted for 7.6% of the market in 2025, and that figure rather than any ranking describes the competitive position, because road freight capacity is held by an extremely large number of operators and no carrier is large enough to influence rates. Competition in truckload therefore turns on cost per mile, driver retention and routing guide position for the asset carriers, and on carrier access and cost of capacity for the non-asset providers selling the same freight, while competition in less-than-truckload turns on terminal coverage and freight density, which is why margins across the market move independently of each other. FedEx Freight Holding Company, Inc. began trading separately on 1 June 2026, and several truckload carriers have added less-than-truckload operations to reduce their exposure to spot rate cycles. Acquisition activity in truckload buys drivers and customer relationships rather than equipment, since vehicles are readily available, and it does not remove capacity from the market because the trucks continue to operate under the new owner. Less-than-truckload acquisitions behave differently, because the terminals acquired add coverage the buyer could not have built, which is why the segment has consolidated while truckload has not.
Some of the key players operating in the truckload and LTL freight services market are Old Dominion Freight Line, Inc. (U.S.), FedEx Freight Holding Company, Inc. (U.S.), C.H. Robinson Worldwide, Inc. (U.S.), XPO, Inc. (U.S.), Knight-Swift Transportation Holdings Inc. (U.S.), TFI International Inc. (Canada), Saia, Inc. (U.S.), ArcBest Corporation (U.S.), J.B. Hunt Transport Services, Inc. (U.S.), Landstar System, Inc. (U.S.), Schneider National, Inc. (U.S.), Werner Enterprises, Inc. (U.S.), Estes Express Lines, Inc. (U.S.), RXO, Inc. (U.S.), Ryder System, Inc. (U.S.), Loadsmart, Inc. (U.S.), Waberer’s International Nyrt. (Hungary), and Nippon Express Holdings, Inc. (Japan), among others.
- —
FedEx Freight Holding Company, Inc. began trading on the New York Stock Exchange as a separate company on 1 June 2026 following its spin-off from FedEx Corporation, and Regulation (EU) 2024/1610 set carbon dioxide reduction requirements of 45% from 2030, 65% from 2035 and 90% from 2040 for new heavy-duty vehicles.
- C.H. Robinson Worldwide, Inc.
- Knight-Swift Transportation Holdings Inc.
- Landstar System, Inc.
- Schneider National, Inc.
- J.B. Hunt Transport Services, Inc.
- Werner Enterprises, Inc.
- RXO, Inc. and Loadsmart, Inc.
Expert perspectives
Truckload and less-than-truckload are two different businesses reported as one market, and treating them together obscures the only thing that matters about either. Truckload has no barrier to entry, so capacity arrives whenever rates rise and departs when they fall, and no carrier holds pricing power for long. Less-than-truckload is built on terminal networks that take years and large sums to assemble, so capacity cannot respond to demand and pricing holds through cycles. That asymmetry explains why the smaller segment grows faster and earns better margins than the larger one.
The withdrawal of a major United States less-than-truckload carrier in July 2023 proved the asymmetry rather than disturbing it. When a truckload carrier fails its tractors are resold and operating within weeks, so the capacity never leaves the market. When a less-than-truckload carrier fails its terminals sit empty until someone buys and reopens them, which takes years, and the pricing that resulted held through a freight recession that would ordinarily have eroded it. Carriers able to buy terminals when they become available acquire market access that cannot be built, and that is the most valuable transaction available in this market.
Driver availability rather than vehicle availability sets the ceiling on this market, and no amount of capital expenditure moves it. Carriers hold tractors they cannot staff, pay increases move drivers between employers without adding to the total, and the cost of that competition passes into rates while operable capacity stays where it was. The effect falls hardest on long haul work, which is why regional operations and dedicated contracts that return drivers home are growing faster than the market as a whole.
The next consolidation in this market will be driven by emission standards rather than by any commercial advantage. Carriers face fleet replacement on a timetable set by regulation rather than by equipment condition, zero-emission tractors cost more and offer less range, and the infrastructure for long haul deployment is not in place. Operators with balance sheet depth will meet the deadlines and those without financing will not, so capacity will concentrate among larger carriers for reasons unconnected with how well any of them is run. The same constraint favours regional and drayage operations, where vehicles cycle through a fixed base and can be charged at one location.
Growth in the truckload and LTL freight services market rests on the volume of goods that must move by road because no other mode reaches the destination, and it is paced by driver supply, insurance cost and the capital demands of fleet replacement. Carriers holding terminal networks, dedicated contracts and temperature controlled equipment will take a disproportionate share of the increase, while dry van truckload will continue to earn close to the cost of running a truck.
Customer perspectives
Retail shippers treat the two halves of this market as separate purchases, and the absence of alternative terminal coverage is what gives less-than-truckload carriers the pricing position the sector now accepts, while truckload rates across the sector are retendered as often as capacity allows and carriers are changed without consequence for service, which is the practical difference the sector observes between a commodity service and a networked one.
Food and beverage shippers buy evidenced temperature performance rather than rate, which is why refrigerated capacity holds firmer pricing across the sector than dry van work, and why the segment is the fastest-growing end user in this market despite moving less tonnage than retail and consumer goods.
Manufacturing shippers exiting private fleets rather than recapitalising them is the condition driving dedicated contract carriage growth across the sector, with the decision usually taken at a fleet replacement cycle rather than at a procurement review, and the emission standards now attached to new vehicles have brought those decisions forward across the industry.
“Our industry can replace a truckload carrier in a week, and we cannot replace an LTL carrier at all in some markets because nobody else has a terminal there. That is why we negotiate the two completely differently.”
“In our industry the cheapest reefer is not the one we want, because a temperature excursion is a destroyed load and a customer conversation. We pay above market to carriers who can show us the data for every trip.”
“We ran our own trucks for thirty years and we are not buying the next generation of them. Our sector has no reason to put capital into equipment that regulation will make us replace again.”
Frequently asked questions
The market was valued at USD 2,180.00 billion in 2025 and USD 2,090.00 billion in 2024, and is estimated at USD 2,310.00 billion in 2026.
Cite this report
Meticulous Research. (2026). Truckload and Less-than-Truckload (LTL) Freight Services Market - Global Opportunity Analysis and Industry Forecast (2026-2036) (Report No. MRAUTO - 1042550). Meticulous Market Research Pvt. Ltd. https://www.meticulousresearch.com/product/truckload-and-ltl-freight-services-market-7233