Managed Transportation Services Market (2026-2036)
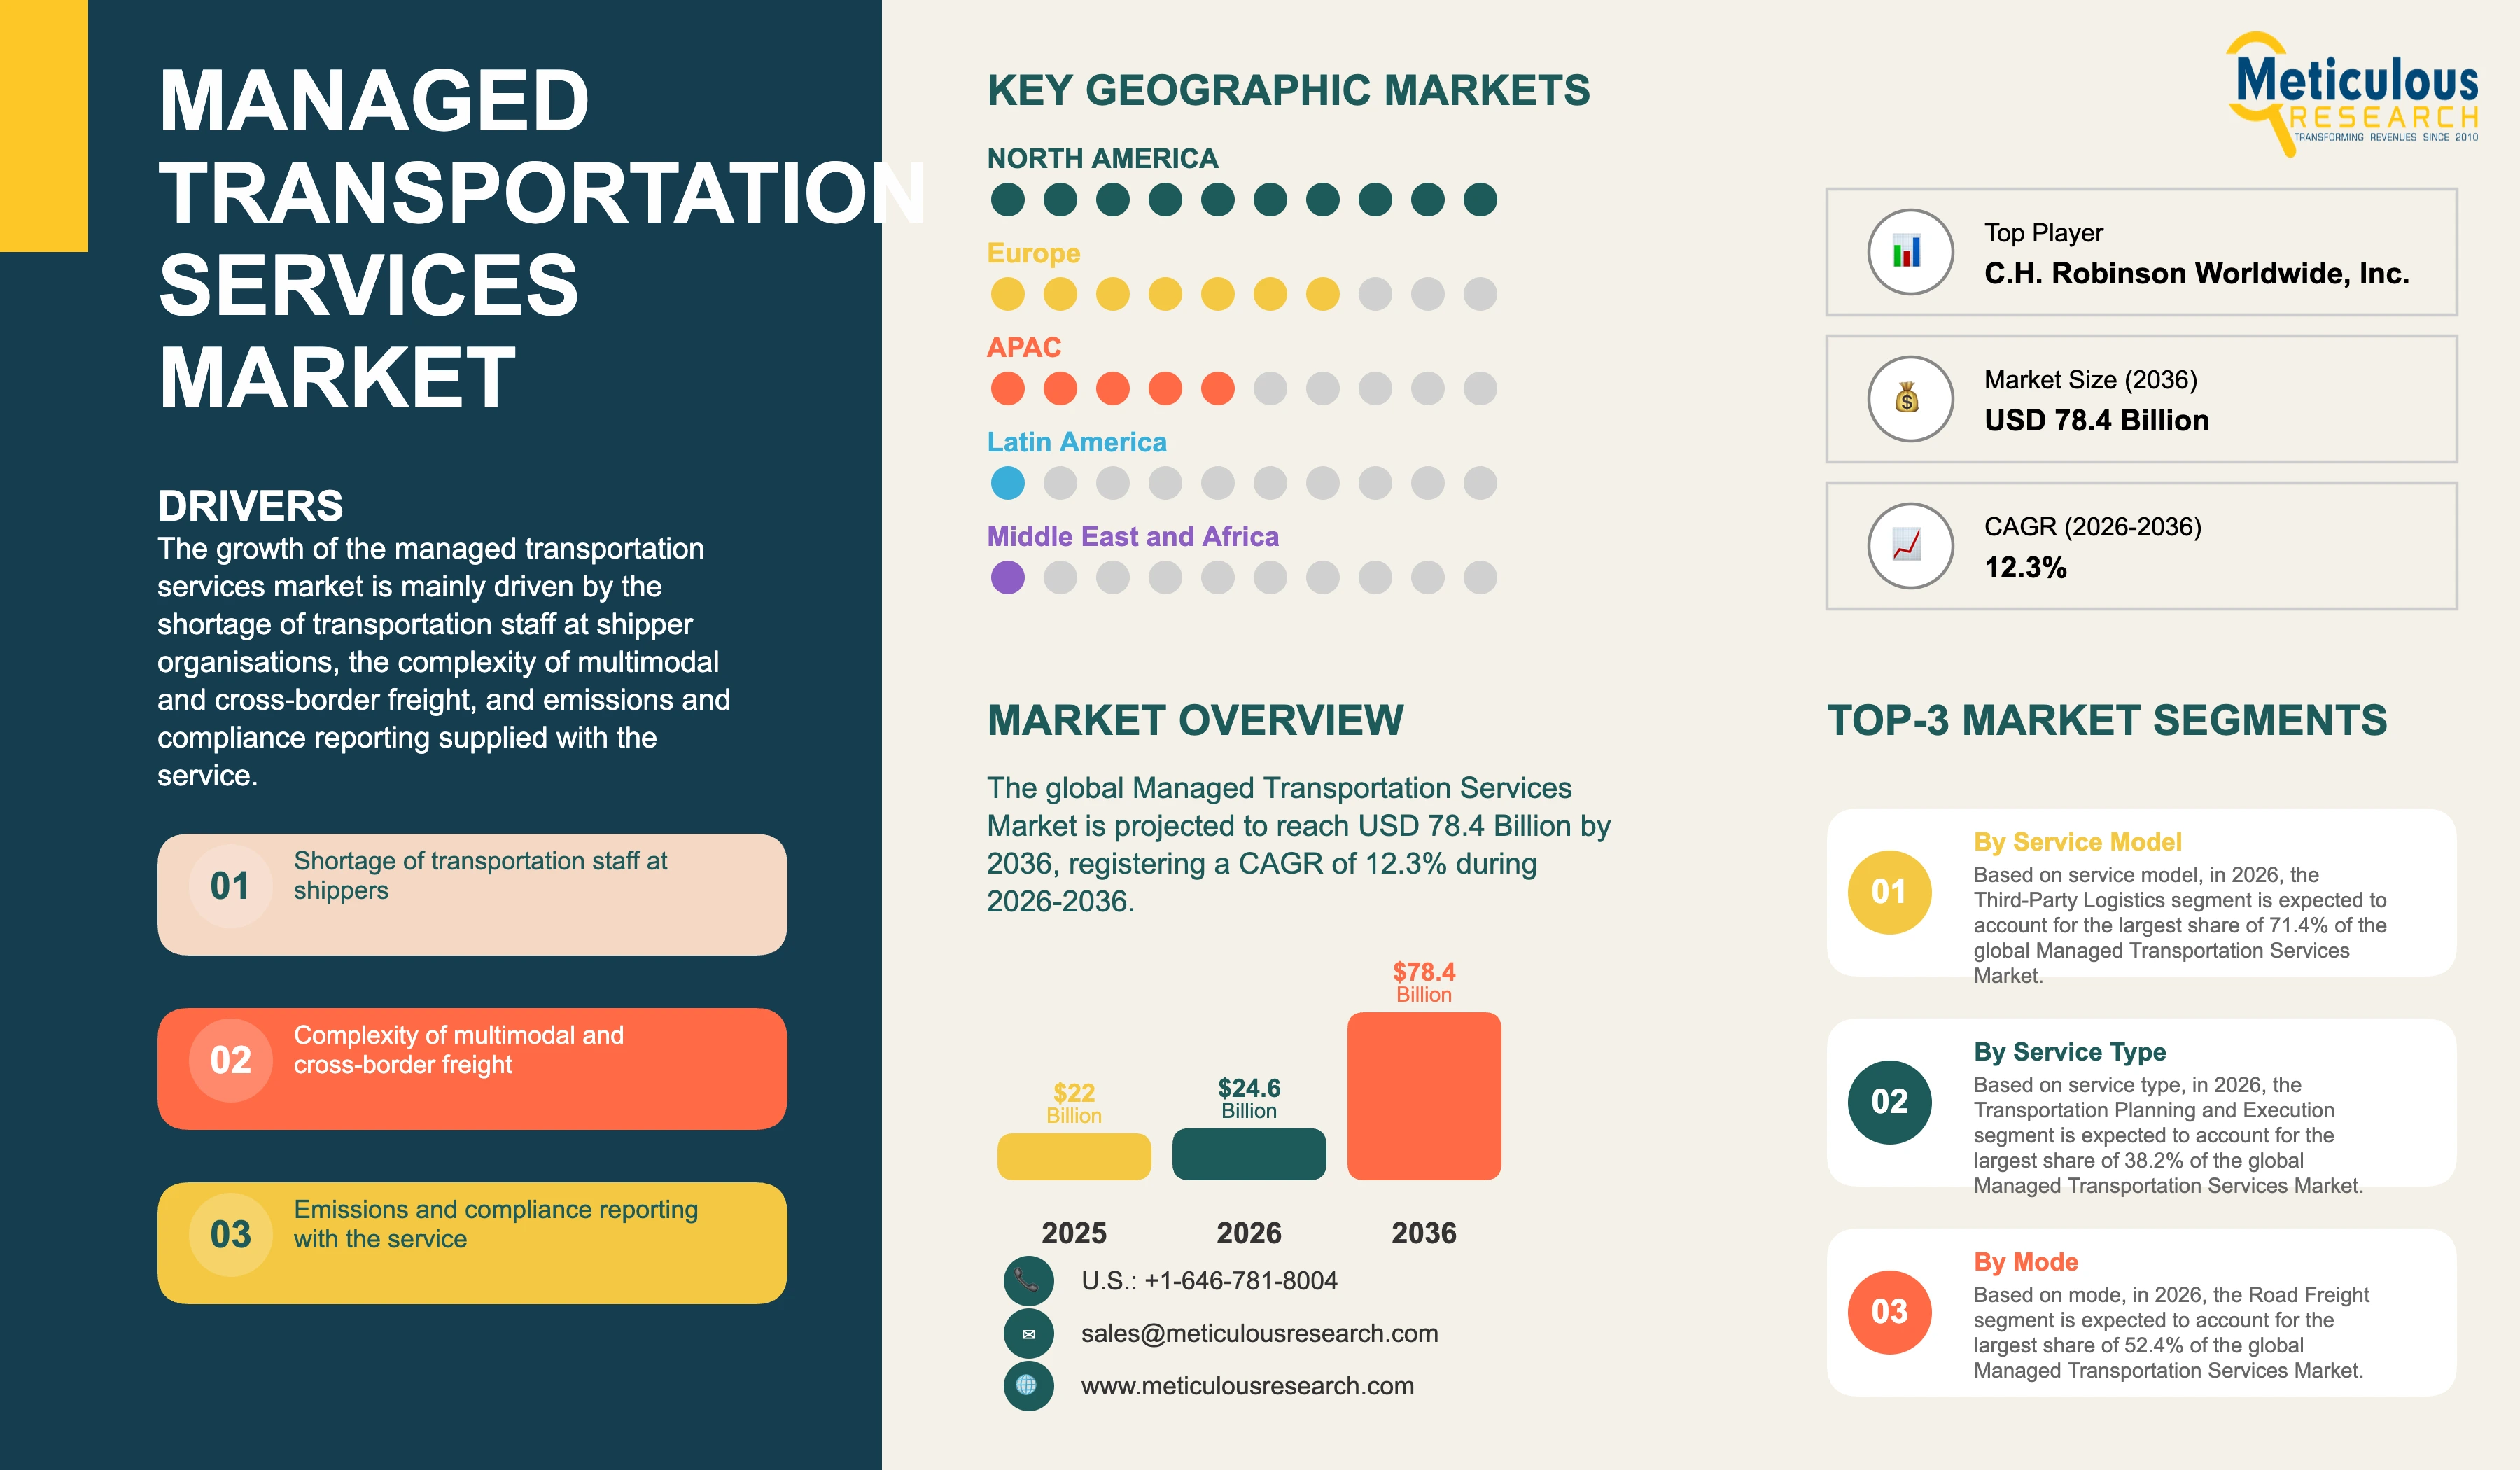
The global managed transportation services market was valued at USD 22.00 billion in 2025. This market is expected to reach USD 78.40 billion by 2036 from an estimated USD 24.60 billion in 2026, registering a CAGR of 12.3% during the forecast period (2026-2036).
- Published
- Nov 2026
- Pages
- 256
- Format
- PDF + Excel
- Report ID
- MRAUTO - 1042549
- Base year
- 2025
- 2025 · BASELINE
- $22.00B
- 2036
- $78.40B
- CAGR 2026–2036
- 12.3%
2025 baseline · 2026–2036 forecast at 12.3% CAGR · hover a bar for the value
Key highlights
The global managed transportation services market is estimated at USD 24.60 billion in 2026 and is projected to reach USD 78.40 billion by 2036.
Third-party logistics models are expected to account for the largest share of 71.4% in 2026, while fourth-party logistics is projected to register the highest CAGR of 15.1%.
Transportation planning and execution is expected to hold the largest service type share of 38.2% in 2026, while control tower and visibility services are projected to grow fastest at a CAGR of 16.4%.
Road freight is expected to be the largest mode with a share of 52.4% in 2026, while parcel is projected to register the highest CAGR of 15.8%.
Retail and consumer goods is expected to be the largest end user with a share of 25.8% in 2026, while healthcare and pharmaceuticals is projected to grow fastest at a CAGR of 15.4%.
North America is expected to hold the largest share of 42.6% in 2026, while Asia-Pacific is projected to register the highest CAGR of 15.6%.
DSV A/S completed its acquisition of Schenker on 30 April 2025, creating one of the largest providers in the sector.
A proposed United States rule published in November 2024 would require brokers to produce electronic transaction records within 48 hours of a request.
ISO 14083:2023 provides the published methodology for quantifying transport chain emissions.
European Union authorities must accept freight data from certified electronic platforms from 9 July 2027.
Report summary
| Particulars | Details |
|---|---|
| Forecast Period | 2026-2036 |
| Base Year | 2025 |
| Estimated Year | 2026 |
| CAGR (Value) | 12.3% |
| Format | PDF, Excel & Cloud Portal · 256 pages |
| Market Size (Value) in 2025 | USD 22.00 billion |
| Market Size (Value) in 2026 | USD 24.60 billion |
| Market Size (Value) in 2036 | USD 78.40 billion |
| Segments Covered | Service Model, Service Type, Mode, End User, and Geography |
| Countries Covered | North America, Europe, Asia-Pacific, Latin America, and Middle East & Africa |
| Key Companies | 13 leading players |
| Service Models Covered | Third-Party Logistics and Fourth-Party Logistics |
| Service Types Covered | Transportation Planning and Execution, Carrier Procurement and Management, Freight Audit and Payment, Control Tower and Visibility, and Analytics and Consulting |
| Modes Covered | Road, Ocean, Air, Rail and Intermodal, and Parcel |
| End Users Covered | Retail and Consumer Goods, Manufacturing and Industrial, Food and Beverage, Automotive, Healthcare and Pharmaceuticals, Chemicals and Energy, and Other End Users |
Report overview
Segments covered: service model, service type, mode, end user.
The growth of this market is mainly driven by the shortage of transportation staff that leads shippers to outsource the function rather than recruit for it, the rising complexity of multimodal and cross-border freight that a single internal team cannot cover, the requirement to report transport emissions and compliance records that providers can produce as part of the service, and the cost advantage a provider holds through buying capacity across many shippers. However, factors such as the conflict of interest where a provider managing carriers also sells its own capacity, the loss of internal transportation capability that makes a shipper dependent on the provider, the difficulty of agreeing savings measurement when the baseline is disputed, and the reluctance of shippers to hand over carrier relationships built over years are expected to restrain the growth of this market to some extent.
Third-party logistics models account for the largest share of this market because the provider manages freight and supplies capacity under one contract, which is the arrangement most shippers buy first. Fourth-party logistics grows faster as shippers separate the management of carriers from the supply of capacity to remove the conflict that arises when one party does both.
Managed transportation services place the design and running of a shipper transportation function with an outside provider. The provider builds the routing guide, runs the carrier tender process, executes daily movements, settles freight invoices and reports on cost and service, and the shipper retains the commercial relationship with its customers while giving up the operation behind it. What is bought is a function rather than a movement, which is why contracts run for three to five years and are measured against a cost baseline rather than against a rate per load.
Third-party logistics and fourth-party logistics describe different positions in the same contract. A third-party provider manages the freight and supplies capacity from its own network, so the shipper deals with one party for both management and movement. A fourth-party provider manages carriers without supplying capacity, which can include managing other third-party providers, and its revenue comes from the management fee rather than from the freight. The distinction matters commercially because a provider that sells capacity has a reason to route freight to its own network, and a shipper that wants carrier selection made on merit alone has to separate the two roles.
The conflict between managing carriers and selling capacity shapes how contracts are written. Open book arrangements require the provider to show what it paid the carrier and earn a stated management fee, gain share arrangements pay the provider a proportion of verified savings, and closed book arrangements leave the provider to keep the difference between what it charges and what it pays. Shippers moving from closed to open book do so to see the carrier cost, and providers resist because the margin becomes visible and negotiable. The pricing structure rather than the service scope is usually what decides a renewal.
Transportation staff shortage is the condition that brought many shippers into this market. Recruiting and retaining people who can run a routing guide, negotiate with carriers and resolve daily exceptions has become difficult at every scale, and a mid-sized shipper that loses two experienced staff can lose the capability altogether. Outsourcing converts a hiring problem into a contract, and it transfers the training and turnover burden to a provider that spreads it across many customers. The decision is frequently made after a departure rather than as part of a strategy review.
Reporting obligations have moved onto the provider in the same way the operation did. Iso 14083:2023, titled greenhouse gases, quantification and reporting of greenhouse gas emissions arising from transport chain operations, was published in march 2023 by iso/tc 207/sc 7 and establishes a common methodology for quantifying and reporting the greenhouse gas emissions of transport chain operations, and a shipper that has outsourced transportation no longer holds the shipment data needed to produce the figure. Providers therefore supply the emissions record as part of the service and are selected partly on whether they can produce one that survives audit. Regulation (eu) 2020/1056 on electronic freight transport information applies in full from 9 july 2027, from which point competent authorities in every member state must accept freight transport data when a business shares it through a certified efti platform, which places the same responsibility for electronic consignment data with whoever executes the movement.
In the United States, managed transportation providers act as property brokers when they place freight with carriers they do not own, and the regulatory position follows them. the Federal Motor Carrier Safety Administration published a proposed rule titled Transparency in Property Broker Transactions at 89 FR 91648 on 20 November 2024, which would require a property broker to keep the transaction records described at section 371.3(a) of Title 49 of the Code of Federal Regulations in electronic form and to provide them within 48 hours of a request from a party to the transaction. A provider operating under a closed book arrangement would hold records showing what it charged the shipper and what it paid the carrier, and producing them on request makes the margin visible to a party that may also be the shipper. The proposal therefore bears on pricing structure rather than only on recordkeeping.
The economic argument for buying the service rests on scale in carrier purchasing that no single shipper can assemble. A provider tendering freight for many shippers holds volume on lanes where any single shipper holds little, and it can offer a carrier a balanced round trip that no one customer could assemble. The saving that follows is real but it is also the part of the proposition a shipper cannot verify without seeing the carrier cost, which returns the discussion to contract structure. Providers that publish benchmarks or operate open book by default compete on a different basis from those that do not.
North America, with a share of 42.6% in 2026 at USD 10.48 billion, with the United States growing at a CAGR of 10.6%.
Asia-Pacific, at a CAGR of 15.6%, with India at 17.2% and China at 15.1%.
Europe holds a share of 30.2% in 2026 at USD 7.43 billion and is projected to grow at a CAGR of 12.1%, with Germany at 12.3%.
The Middle East & Africa holds 3.0% at USD 0.74 billion with a CAGR of 13.1%, and Latin America holds 3.8% at USD 0.93 billion with a CAGR of 13.8%, with Brazil at 14.2%.
The 13 companies profiled accounted for 45.4% of the market in 2025, and the top five players, C.H. Robinson Worldwide, Inc., DSV A/S, Kuehne + Nagel International AG, DHL Group and Uber Technologies, Inc., accounted for 29.8%.
Transportation planning and execution, with a share of 38.2% in 2026 at USD 9.40 billion.
Control tower and visibility, at a CAGR of 16.4%, from USD 3.15 billion and a share of 12.8% in 2026.
Road freight, with a share of 52.4% in 2026 at USD 12.89 billion.
Parcel, at a CAGR of 15.8%, from USD 1.35 billion and a share of 5.5% in 2026.
Retail and consumer goods, with a share of 25.8% in 2026 at USD 6.35 billion.
Healthcare and pharmaceuticals, at a CAGR of 15.4%, from USD 2.78 billion and a share of 11.3% in 2026.
Report infographic
Market dynamics
15 factors across 5 forcesShortage of Transportation Staff at Shipper Organisations
Running a transportation function requires people who can build a routing guide, hold carrier negotiations, manage daily exceptions and settle disputed invoices, and that combination of commercial and operational skill is scarce and expensive at every scale. Shippers that lose experienced staff often cannot replace them at the salary the role was budgeted at, and the capability degrades quickly because the knowledge sat with individuals rather than in systems. Outsourcing the function converts the problem into a contract with service levels, and the provider carries the recruitment and turnover burden across a customer base rather than within one organisation. Entry into the managed transportation services market is therefore often triggered by a departure rather than by a procurement cycle, which is why demand holds through periods when freight volumes fall. The effect is strongest among shippers with between fifty and five hundred loads a week, where the work is too large for a part-time buyer and too small to justify three or four specialists, and where a single resignation removes the only person who knew the carrier base. Providers recruit into a career path that a shipper logistics department cannot offer, so they retain the skill the shipper could not hold.
Complexity of Multimodal and Cross-Border Freight
A shipper moving goods across road, ocean, air and rail in several jurisdictions needs customs documentation, carrier contracts and visibility in each, and the number of parties involved in a single international movement exceeds what a small internal team can coordinate. Providers hold the licences, the customs capability and the carrier relationships in each mode and region already, so the shipper buys access rather than building it. Nearshoring and the reconfiguration of supply chains have added new corridors that shippers have no experience in, and the fastest route to capability in a new corridor is a provider that already operates there. Complexity rather than cost is now the more common reason for the first managed transportation contract. Documentation errors in cross-border movements carry consequences that domestic errors do not, because goods are held rather than delayed and the cost falls on inventory as well as freight, and shippers unwilling to accept that exposure buy the capability rather than learn it.
Emissions and Compliance Reporting Supplied With the Service
Shippers are asked for transport emissions by customers and under disclosure regimes, and the data required sits with whoever executed the movement rather than with the party reporting it. A shipper that has outsourced transportation cannot produce the figure without the provider, so the reporting capability has become part of the service specification rather than an additional request. The same applies to compliance records in cross-border movements and to the audit trail behind freight payments, and providers that can produce records that survive examination are selected over those that cannot. The reporting requirement has made the provider the holder of data the shipper is accountable for, which deepens the relationship beyond the operation itself. It also raises the cost of changing provider, because a new provider has to reconstruct a reporting history that the shipper may need to present on a comparable basis across years.
Cost Advantage From Buying Capacity Across Many Shippers
A provider tendering freight on behalf of many customers holds volume on lanes where any single shipper holds little, and it can assemble balanced round trips from freight that individual shippers could not pair. Carriers price that volume and balance below what they quote a single shipper on an unbalanced lane, and the difference funds both the saving the shipper receives and the provider margin. The advantage is largest for mid-sized shippers whose volumes are too small to command attention from carriers directly and whose lanes are too scattered to build a routing guide around. That is also the segment where internal capability is thinnest, which is why the two drivers reinforce each other in the same buyer group. Invoice audit reinforces the same advantage, because a provider processing freight bills at volume identifies accessorial and surcharge errors that a shipper paying a few hundred invoices a month has no basis to detect.
Table of contents
12 chapters · 137 sections · 256 pages · click to expandSegmental analysis
| Segment | Largest share (2026) | Fastest growth (2026–2036) |
|---|---|---|
| By Service Model | Third-party logistics | Rapid growth of this |
| By Service Type | Transportation planning and execution | Rapid growth of this |
| By Mode | Road freight | Rapid growth of this |
| By End User | Retail and consumer goods | Rapid growth of this |
By Service Model
- Managed Transportation Services Analysis by Service Model
- The third-party logistics segment is expected to account for the largest share of 71.4% of the global managed transportation services market, valued at USD 17.56 billion.
- The large share of this segment is mainly due to the single contract under which the provider both manages the freight and supplies capacity, which is simpler for a shipper to buy and to govern than two separate arrangements, and to the carrier buying advantage the provider holds through its own network.
- Shippers entering the market for the first time also prefer a provider that can take operational responsibility immediately rather than one that must assemble capacity from others, and the provider in turn can commit to service levels it controls rather than ones it depends on third parties to meet.
- However, the fourth-party logistics segment, valued at USD 7.04 billion in 2026 and accounting for a share of 28.6%, is projected to register the highest CAGR of 15.1% during the forecast period.
- The rapid growth of this segment is attributed to shippers separating carrier management from capacity supply to remove the conflict that arises when one party performs both roles, and to the preference among larger shippers for a provider whose revenue comes from a management fee rather than from the freight it awards.
- The model also allows a provider to manage other third-party providers within one arrangement, which suits shippers that have accumulated several regional contracts and want them governed together.
- Third-party logistics, with a share of 71.4% in 2026 at USD 17.56 billion.
- Fourth-party logistics, at a CAGR of 15.1%, from USD 7.04 billion and a share of 28.6% in 2026.
By Service Type
- Managed Transportation Services Analysis by Service Type
- The transportation planning and execution segment is expected to account for the largest share of 38.2% of the global managed transportation services market, valued at USD 9.40 billion.
- The large share of this segment is mainly due to the daily operational work that a managed contract transfers, because tendering, booking, tracking and exception handling occur on every shipment and consume the greatest part of the resource the provider supplies.
- Execution is also the element a shipper cannot retain partially, so it is transferred in full wherever a managed contract is signed, and the fee attached to it reflects headcount rather than software, which keeps its value high relative to the other service types.
- However, the control tower and visibility segment, valued at USD 3.15 billion in 2026 and accounting for a share of 12.8%, is projected to register the highest CAGR of 16.4% during the forecast period.
- The rapid growth of this segment is attributed to shippers buying visibility and exception management without transferring execution, which gives providers a route into accounts not ready to outsource the whole function, and to the reporting obligations that require movement level data a shipper no longer holds once freight is executed by others.
- Control tower engagements also serve as the entry point from which wider managed contracts follow.
By Mode
- Managed Transportation Services Analysis by Mode
- The road freight segment is expected to account for the largest share of 52.4% of the global managed transportation services market, valued at USD 12.89 billion.
- The large share of this segment is mainly due to the shipment frequency and carrier fragmentation of road movements, because a shipper may tender thousands of loads a month across hundreds of carriers and the management effort scales with both.
- Road freight also carries the shortest decision windows, so the daily coordination a provider supplies has the greatest operational value here, and the spot and contract mix changes often enough that carrier selection is a continuing decision rather than an annual one.
- However, the parcel segment, valued at USD 1.35 billion in 2026 and accounting for a share of 5.5%, is projected to register the highest CAGR of 15.8% during the forecast period.
- The rapid growth of this segment is attributed to the expansion of direct to consumer shipping among manufacturers and brands that have no parcel expertise, and to carrier surcharge structures complex enough that invoice audit and carrier selection produce measurable savings a shipper cannot achieve alone.
- Parcel contracts also renew more frequently than freight contracts, which brings providers recurring opportunities to win the work.
By End User
- Managed Transportation Services Analysis by End User
- The retail and consumer goods segment is expected to account for the largest share of 25.8% of the global managed transportation services market, valued at USD 6.35 billion.
- The large share of this segment is mainly due to shipment volumes across replenishment, inbound and direct to consumer flows, which together generate more transportation management work than any other industry, and to the seasonal peaks that require capacity a shipper cannot hold through the year.
- Retailers also face supplier compliance programmes and delivery windows that make execution quality commercially visible, because a missed appointment carries a chargeback rather than only a delay, and that exposure justifies paying a provider to manage it.
- Direct to consumer volumes within the same accounts add parcel and final mile management to the freight already under contract, which raises the value of each relationship without adding a new customer.
- However, the healthcare and pharmaceuticals segment, valued at USD 2.78 billion in 2026 and accounting for a share of 11.3%, is projected to register the highest CAGR of 15.4% during the forecast period.
- The rapid growth of this segment is attributed to temperature limits, chain of custody requirements and documentation obligations that make failure a product loss rather than a delay, which raises the value of a provider holding qualified lanes and validated packaging, and to the quality systems that building the same capability internally would require.
- Contracts in this segment are harder to move once lanes are qualified, so providers hold them longer than general freight arrangements.
Geographic analysis
North America
Largest shareIn 2026, North America is expected to account for the largest share of 42.6% of the global managed transportation services market, valued at USD 10.48 billion. The region holds this position because its road carrier base is the most fragmented in the world, which makes carrier management a continuing task rather than an annual negotiation, and because outsourcing the transportation function has been established practice for long enough that most large shippers have held at least one managed contract. The proposed records duty on property brokers applies to providers placing freight with carriers they do not own, which is pushing pricing structures toward open book in advance of any requirement. Canada adds cross-border movements into the same carrier base, which extends the management task without changing the providers that perform it, and Mexican cross-border freight into United States lanes is managed from the same routing guides. The United States is projected to register a CAGR of 10.6% during the forecast period, with growth moderated by the share of large shippers already under contract and by the maturity of the pricing models in use, so regional expansion depends more on mid-market adoption than on new enterprise mandates. The depth of the third-party provider base in the region also means a shipper changing provider has several credible alternatives, which holds management fees down even as the volume of freight under contract rises.
Asia-Pacific
Fastest growthHowever, Asia-Pacific is projected to register the highest CAGR of 15.6% during the forecast period. The rapid growth of this region is attributed to manufacturing relocation that has created new corridors in which shippers have no operating experience, which is the condition under which a provider that already operates there is bought rather than built, and to domestic distribution networks in China and India that were managed informally and are now being contracted. Export freight also requires ocean and air management alongside road, and few shippers in the region hold that capability internally, so a single contract covering several modes is bought where a domestic shipper elsewhere would buy only road management. Growth is also starting from a low base of outsourcing, which means the increase reflects first-time adoption rather than contracts changing hands, and providers entering the region compete on capability rather than against an incumbent fee. Japan, South Korea and Australia behave differently within the same region, with established shippers buying management around retained carrier relationships rather than full outsourcing, so the regional rate is set by the emerging markets within it. India is projected to grow at a CAGR of 17.2% and China at 15.1%.
Competitive landscape
The competitive structure of the managed transportation services market places global freight forwarders that added managed services against asset-light brokers that built them around their networks, and against asset based logistics firms offering them alongside fleets and warehouses. DSV A/S completed its acquisition of Schenker on 30 April 2025 and now competes at a scale across forwarding, contract logistics and managed transportation that few others hold, while Kuehne + Nagel International AG and DHL Group carry the service within wider logistics ranges. C.H. Robinson Worldwide, Inc. and RXO, Inc. reached the same buyers from brokerage, Uber Technologies, Inc. presents managed transportation as one of two solution groups alongside capacity, Loadsmart, Inc. sells managed transportation alongside its transportation management, dock and yard software, and Ryder System, Inc. sells it with dedicated fleets.
Competition turns on carrier buying advantage, on the credibility of the savings measurement and on whether the provider can produce emissions and compliance records that survive examination, rather than on service scope, which is similar across providers. The structural question dividing the field is whether a provider that sells capacity can be trusted to select carriers on merit, and the firms that have built fourth-party positions compete on neutrality while those with networks compete on price. Consolidation has reduced the number of providers able to serve a global shipper across all modes and regions, and it has left the asset-light brokers competing against forwarders whose managed services are supported by freight volumes they already control. Retention rather than new business decides share in this market, because a contract that performs is rarely retendered on scope and a shipper that has lost internal capability has limited appetite for transition risk. Providers therefore compete hardest for first-time outsourcing decisions, where no incumbent has to be displaced.
Some of the key players operating in the managed transportation services market are C.H. Robinson Worldwide, Inc. (U.S.), DSV A/S (Denmark), Kuehne + Nagel International AG (Switzerland), DHL Group (Germany), RXO, Inc. (U.S.), Uber Technologies, Inc. (U.S.), Ryder System, Inc. (U.S.), A.P. Moller - Maersk A/S (Denmark), Expeditors International of Washington, Inc. (U.S.), Nippon Express Holdings, Inc. (Japan), Echo Global Logistics, Inc. (U.S.), Flexport, Inc. (U.S.), and Loadsmart, Inc. (U.S.), among others.
- —
DSV A/S completed its acquisition of Schenker on 30 April 2025, ISO 14083:2023 was published as the methodology for quantifying transport chain emissions, and the first implementing and delegated acts under the European Union electronic freight transport information regulation entered into force in January 2025.
- C.H. Robinson Worldwide, Inc. (U.S.)
- DSV A/S · Denmark
- Kuehne + Nagel International AG · Switzerland
- DHL Group · Germany
- RXO, Inc. (U.S.)
- Uber Technologies, Inc. (U.S.)
- Ryder System, Inc. (U.S.)
- A.P. Moller - Maersk A/S · Denmark
- Expeditors International of Washington, Inc. (U.S.)
- Nippon Express Holdings, Inc. · Japan
- Echo Global Logistics, Inc. (U.S.)
- Flexport, Inc. (U.S.)
- Loadsmart, Inc. (U.S.)
Expert perspectives
A provider that manages carrier selection while selling its own capacity has a reason to route freight to itself, and that conflict is the governing feature of this market rather than a reputational detail. It determines how contracts are priced, why shippers move to fourth-party arrangements at renewal and which providers win the mandates where neutrality is specified. The third-party model will keep the larger share because it is simpler to buy, but it cannot remove the conflict, and that is why the fourth-party segment grows faster from a smaller base.
Pricing structure rather than service scope is where the next few years will be decided. Open book arrangements make the provider margin visible and negotiable, and the records obligation proposed in the United States would make the same information obtainable whether or not a contract discloses it, so providers whose economics rest on an undisclosed spread face an adjustment rather than a negotiation. Those already operating open book with a stated management fee are positioned for that shift, and they are also the providers best placed to win fourth-party mandates.
Capability in the shipper rather than in the provider sets the ceiling on this market. A shipper that outsources for several years loses the people, the carrier relationships and the cost knowledge that would let it bring the function back, and boards that understand this ask for retained capability and knowledge transfer clauses. That dependency slows adoption among shippers for whom transport is a large share of cost, and it explains why the strongest growth sits in the mid-market, where no capability existed to lose.
Specialist freight carries better economics than general managed transportation because the capability behind it is harder to assemble. Healthcare and pharmaceutical freight requires qualified lanes, validated packaging and evidence of conditions throughout the movement, and a contract that has been qualified is expensive for a shipper to move, which is why those arrangements hold longer and price higher. Parcel is the other segment where expertise commands a premium, because surcharge structures are complex enough that audit and carrier selection produce savings a shipper cannot find alone. General road freight management is where competition on price is hardest.
Growth in the managed transportation services market rests on the volume of transportation work still done by internal teams that cannot be staffed, and it is paced by the credibility of savings measurement and by shipper willingness to transfer carrier relationships. Providers that operate open book, hold qualified capability in the specialist segments and produce reporting that survives audit will take a disproportionate share of the increase.
Customer perspectives
Supply Chain Director - consumer goods industry
We did not outsource transport to save money, we outsourced it because we could not keep the team. What our industry now asks of a provider is whether we can see the carrier cost, because the moment we cannot we have no way to test whether the saving is real.
Consumer goods shippers entered this market through a staffing problem rather than a cost programme, and visibility of carrier cost has become the condition on which the relationship is renewed across the sector, which is why open book pricing is spreading faster here than in industries where transport is a smaller share of landed cost.
Logistics Director - pharmaceutical sector
In our sector a failed shipment is a destroyed product and a regulatory conversation, so the qualification of the lane matters more than the rate. Once a provider has qualified our lanes we are not moving the contract for a few percent.
Pharmaceutical shippers buy qualified capability rather than price, and the cost of requalification is what makes healthcare and pharmaceuticals the fastest-growing and most defensible end user in the managed transportation services market, with contract lengths in the sector running beyond those seen in general freight.
Head of Logistics - industrial manufacturing sector
Our concern is that after five years we would not know what our own freight should cost. Our industry has seen that happen, so we keep a small team inside and we buy the management around it rather than handing over everything.
Manufacturing shippers with transport as a large share of cost retain internal capability deliberately, which is the condition pushing demand across the sector toward fourth-party arrangements and control tower services rather than full outsourcing of the transportation function, and why providers selling into industrial accounts lead with governance and visibility rather than with promised savings.
Frequently asked questions
The market was valued at USD 22.00 billion in 2025 and USD 19.80 billion in 2024, and is estimated at USD 24.60 billion in 2026.
Cite this report
Meticulous Research. (2026). Managed Transportation Services Market - Global Opportunity Analysis and Industry Forecast (2026-2036) (Report No. MRAUTO - 1042549). Meticulous Market Research Pvt. Ltd. https://www.meticulousresearch.com/product/managed-transportation-services-market-7232