Intermodal and Drayage Services Market (2026-2036)
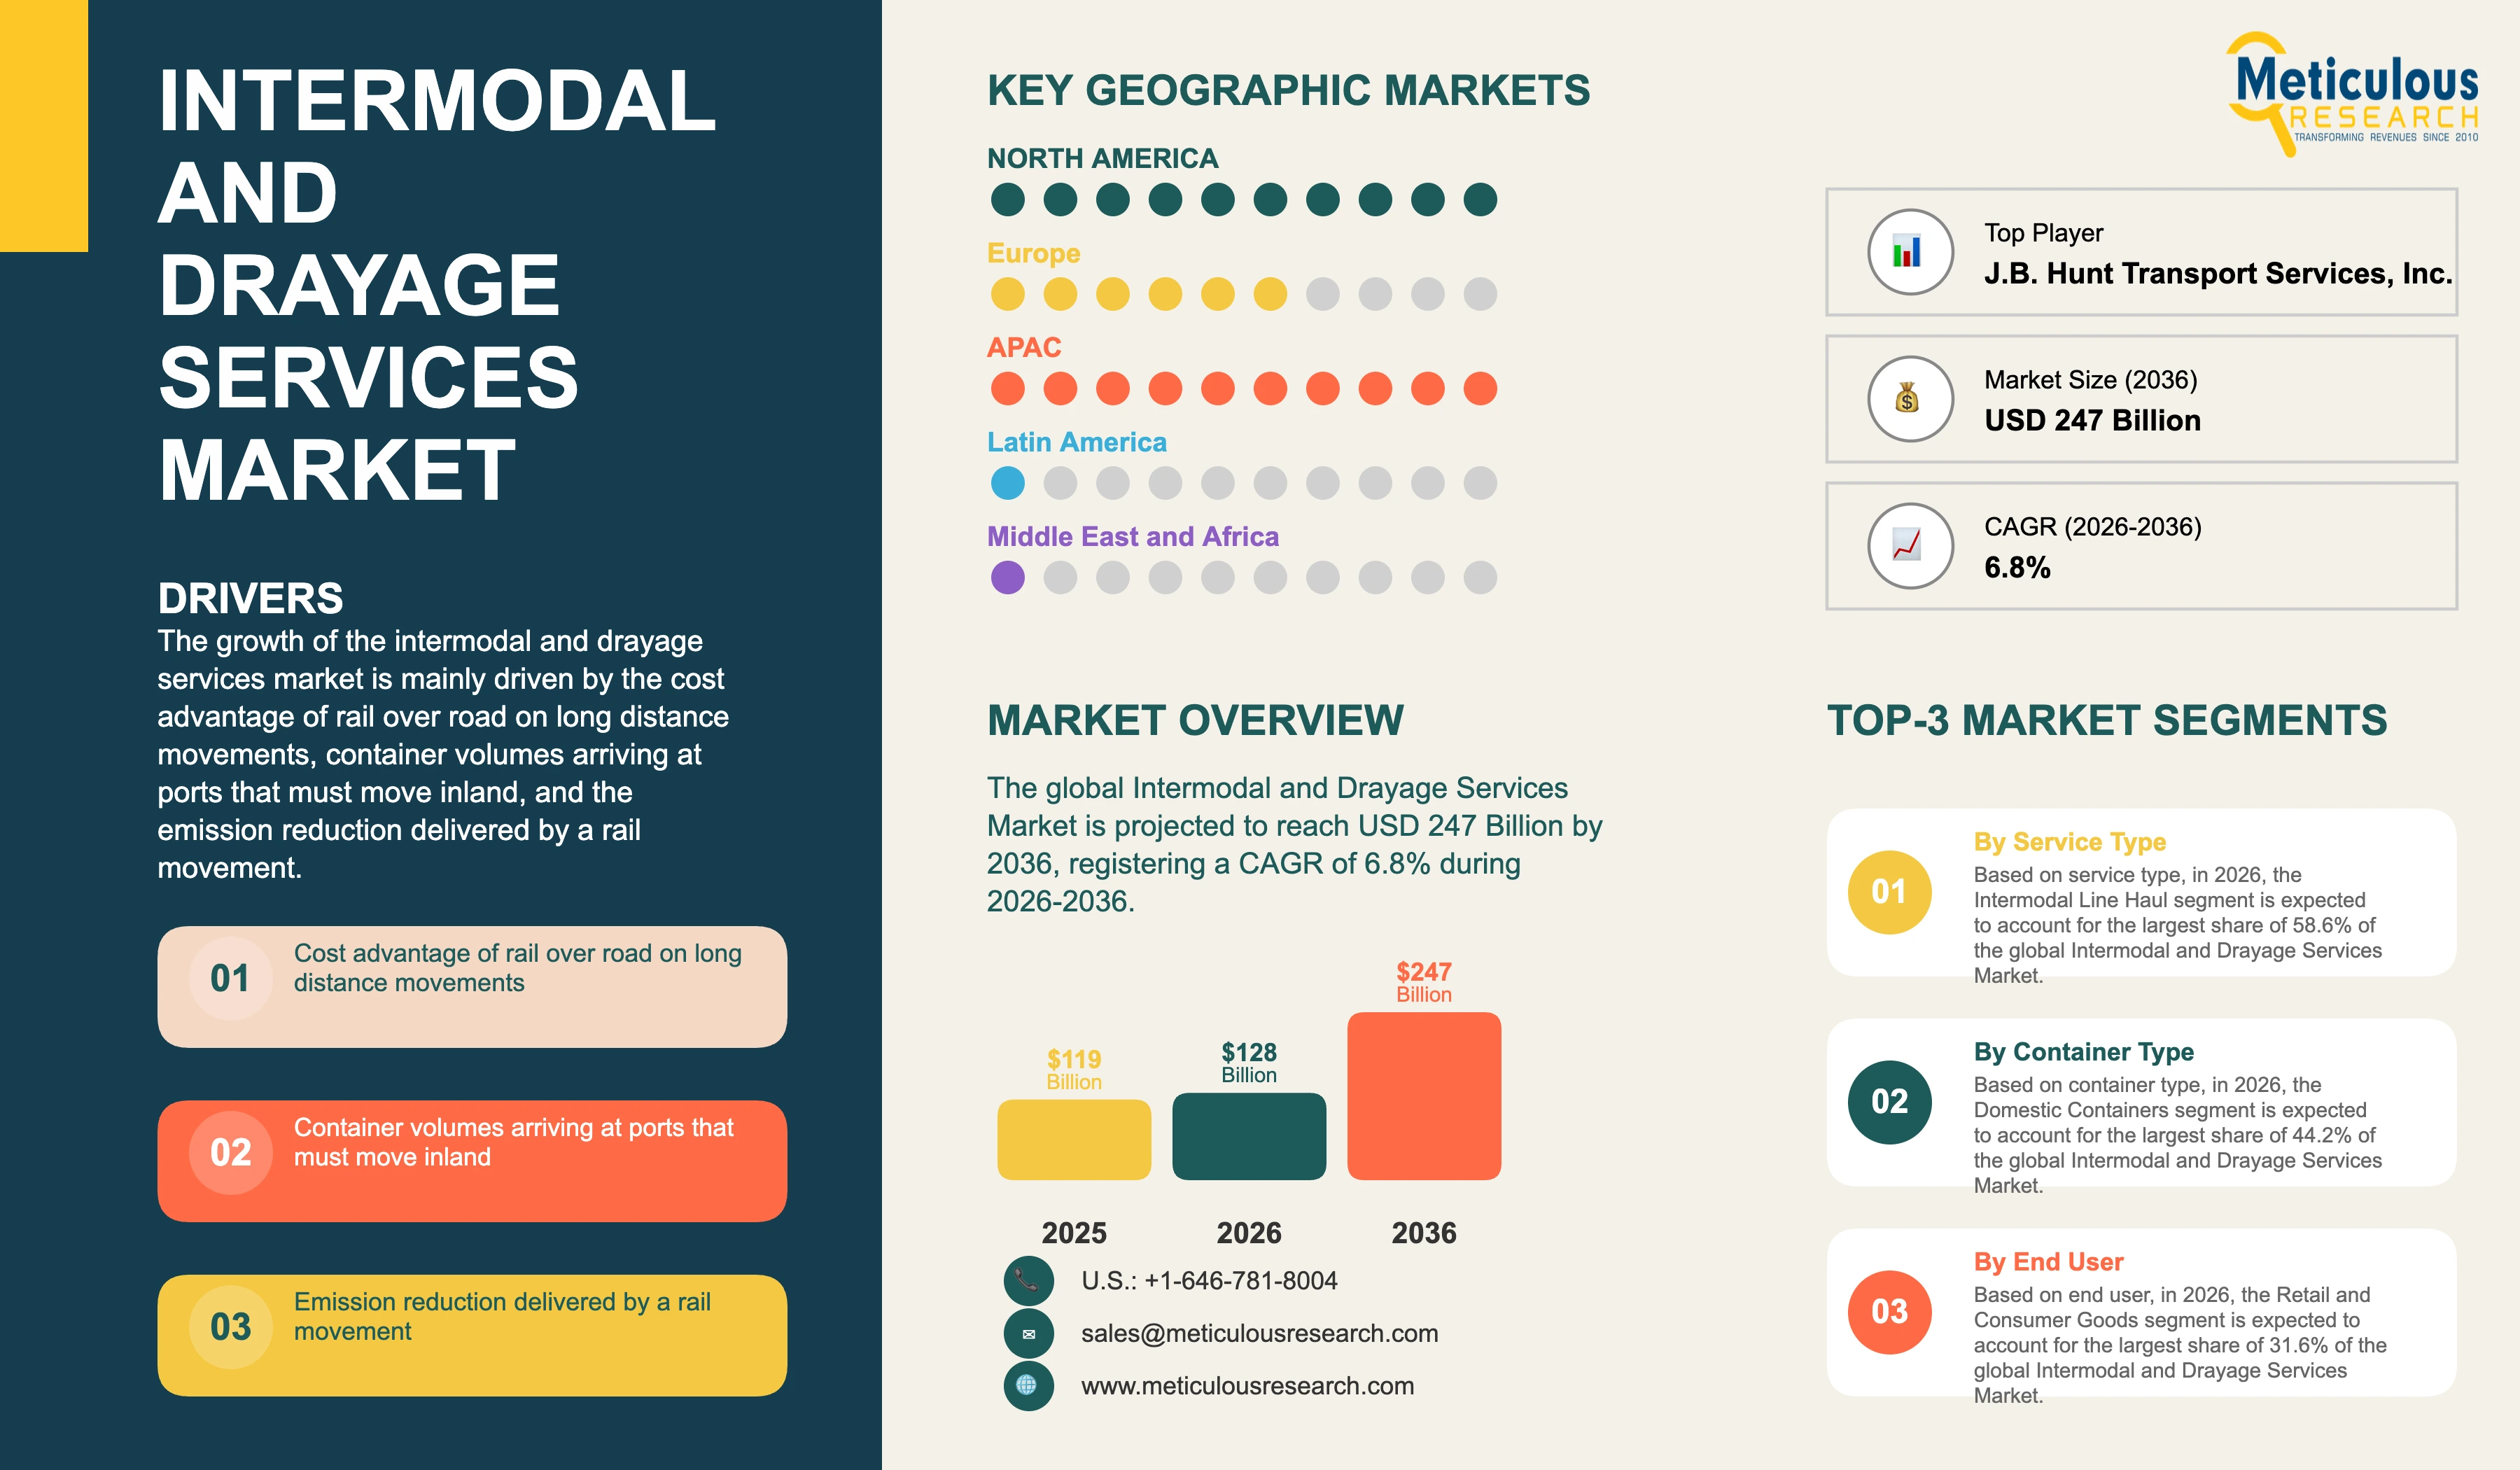
The global intermodal and drayage services market was valued at USD 119.00 billion in 2025. This market is expected to reach USD 247.00 billion by 2036 from an estimated USD 128.00 billion in 2026, registering a CAGR of 6.8% during the forecast period (2026-2036).
- Published
- Nov 2026
- Pages
- 239
- Format
- PDF + Excel
- Report ID
- MRAUTO - 1042553
- Base year
- 2025
- 2025 · BASELINE
- $119.0B
- 2036
- $247.0B
- CAGR 2026–2036
- 6.8%
2025 baseline · 2026–2036 forecast at 6.8% CAGR · hover a bar for the value
Key highlights
The global intermodal and drayage services market is estimated at USD 128.00 billion in 2026 and is projected to reach USD 247.00 billion by 2036.
Intermodal line haul is expected to account for the largest service type share of 58.6% in 2026, while drayage is projected to register the highest CAGR of 7.8%.
Domestic containers are expected to hold the largest container type share of 44.2% in 2026, while international containers are projected to grow fastest at a CAGR of 7.4%.
Retail and consumer goods is expected to be the largest end user with a share of 31.6% in 2026, while chemicals are projected to register the highest CAGR of 7.8%.
Asia-Pacific is expected to hold the largest share of 34.8% in 2026, and it is also the fastest-growing region at a CAGR of 8.4%.
The Surface Transportation Board denied motions for summary denial of the Union Pacific and Norfolk Southern merger application on 18 September 2026 in docket FD 36873.
Opening comments on the merits of that application are due on 18 November 2026, with responses due on 16 February 2027.
BNSF Railway, CSX Transportation and a shipper coalition each filed motions for summary denial on 6 August 2026, which the Board refused while stating that it had not decided the merits.
A transcontinental railroad would remove the Chicago interchange that currently adds transit time to coast-to-coast intermodal movements.
ISO 14083:2023 provides the published methodology by which the emission advantage of a rail movement is quantified for shipper reporting.
Report summary
| Particulars | Details |
|---|---|
| Base Year | 2025 |
| Estimated Year | 2026 |
| Forecast Period | 2026-2036 |
| Market Size in 2025 | USD 119.00 billion |
| Estimated Market Size in 2026 | USD 128.00 billion |
| Projected Market Size by 2036 | USD 247.00 billion |
| CAGR (2026-2036) | 6.8% |
| Format | PDF, Excel & Cloud Portal · 239 pages |
| Measurement Basis | Freight charges paid by shippers for intermodal and drayage movements, including services sold by providers that own no track |
| Segments Covered | Service Type, Container Type, End User, and Geography |
| Service Types Covered | Intermodal Line Haul, Drayage (Port, Rail Ramp, Cross-Border, and Transload), and Transload and Container Handling |
| Container Types Covered | Domestic Containers, International Containers, and Trailers on Flatcar and Specialized |
| End Users Covered | Retail and Consumer Goods, Manufacturing and Industrial, Food and Beverage, Automotive, Chemicals, and Paper, Building Materials and Other End Users |
| Geographies Covered | North America, Europe, Asia-Pacific, Latin America, and Middle East & Africa |
| Companies Profiled | 14 leading players |
Report overview
Segments covered: service type, container type, end user.
The growth of this market is mainly driven by the cost advantage rail holds over road on long distance movements, the container volumes arriving at ports that must be moved inland, the fuel and emission reduction a rail movement delivers against the same journey by road, and the conversion of long haul truckload freight to intermodal where transit time permits. However, factors such as the drayage legs at either end that determine whether an intermodal movement works at all, the chassis and equipment provision that no single party controls, the interchange between railroads that adds transit time on transcontinental moves, and the driver availability for short haul work paid by the turn rather than by the mile are expected to restrain the growth of this market to some extent.
Intermodal line haul accounts for the largest share of this market because the rail movement covers the greatest distance and carries the largest proportion of the freight charge. Drayage grows faster because every intermodal movement requires two drayage legs and because port and cross-border container volumes generate drayage that involves no rail movement at all.
Intermodal and drayage services move freight in a container or trailer across more than one mode without the goods being handled, measured here as the freight charges shippers pay for those movements whether the service is sold by the railroad operating the train, by an intermodal marketing company that owns no track, or by a drayage operator running the trucks. A typical movement consists of a short truck leg from the shipper to a rail ramp, a rail line haul, and a second short truck leg to the consignee, and the commercial question in this market is which of those three legs determines whether the movement happens.
The rail line haul is the cheap and reliable part of the journey, and it is not where the commercial risk sits. A train carries several hundred containers with one crew over a distance that would require hundreds of drivers by road, and the fuel consumed per container mile is a fraction of the road equivalent, which is why rail holds a structural cost advantage on long distance movements and why that advantage grows with distance. The line haul also carries the greatest part of the freight charge for the same reason, and it is the segment that holds the largest share of this market.
Whether an intermodal movement works at all is decided on the drayage legs rather than on the rail leg. The two short truck legs are where the container sits on a chassis waiting for a terminal appointment, where per diem and detention accrue, where a driver is required for a job paid by the turn rather than by the mile, and where a delay at a gate consumes hours that the rail leg saved. A shipper comparing intermodal against truckload compares total transit and total cost, so an intermodal movement with a cheap line haul and an unreliable drayage leg loses to a single truck that collects and delivers without an intermediate handling. That is why drayage grows faster than the line haul it serves.
The asset chain on a drayage leg is held by four parties and controlled by none of them. The container belongs to the railroad or the ocean carrier, the chassis belongs to an equipment provider or sits in a pool, the tractor and driver belong to a drayage operator, and the appointment belongs to the terminal. Each party optimises its own asset, a shortage in any one of them stops the movement, and the shipper paying the freight charge has no contractual relationship with most of them. The fragmentation of equipment provision rather than the availability of trucks is the practical constraint on drayage capacity at most ports and ramps.
Interchange between railroads imposes the other structural cost in this market, and it falls on transit time rather than on price. A container moving between the western and eastern United States is carried by one railroad to Chicago, handed to another and carried onward, and the handover adds hours or days that the rail leg cannot recover. The Surface Transportation Board denied motions for summary denial of the Union Pacific and Norfolk Southern merger application on 18 September 2026 in docket FD 36873, keeping proceedings open on a combination that would place a single railroad on both sides of that interchange, with opening comments on the merits due 18 November 2026 and responses due 16 February 2027. BNSF Railway, CSX Transportation and a shipper coalition had each moved for summary denial on 6 August 2026, and the Board refused while stating it had not decided the merits.
Intermodal is now bought for emission reasons as well as cost ones. A rail movement produces materially lower greenhouse gas emissions than the same journey by road, and ISO 14083:2023, published in March 2023 by ISO/TC 207/SC 7, establishes a common methodology for quantifying and reporting the emissions of transport chain operations, so the advantage can be stated on a basis a shipper auditor will accept. Shippers with emission reduction commitments therefore convert freight to intermodal on lanes where the transit time is tolerable, and the conversion is recorded against a target rather than only against a freight budget.
A large part of drayage demand exists independently of any rail movement. Containers arriving at a port must be moved to a warehouse, a transload facility or an inland terminal whether or not a train is involved, and cross-border container movements generate the same work. That portion of drayage grows with port volumes rather than with rail conversion, which is why the segment does not track the line haul it is usually described as serving.
Asia-Pacific, with a share of 34.8% in 2026 at USD 44.54 billion, with China growing at a CAGR of 8.8% and India at 10.2%.
Asia-Pacific, at a CAGR of 8.4%, which is also the largest region.
North America holds a share of 33.4% in 2026 at USD 42.75 billion and is projected to grow at a CAGR of 5.5%, with the outcome of the Union Pacific and Norfolk Southern proceeding in docket FD 36873 determining whether transcontinental containers avoid interchange at Chicago.
Europe holds a share of 22.6% in 2026 at USD 28.93 billion and is projected to grow at a CAGR of 6.0%, with Germany at 5.8%.
The Middle East & Africa holds 4.0% at USD 5.12 billion with a CAGR of 7.0%, and Latin America holds 5.2% at USD 6.66 billion with a CAGR of 7.6%, with Brazil at 7.8%.
The 14 companies profiled accounted for 52.4% of the market in 2025, and the top five players, J.B. Hunt Transport Services, Inc., Union Pacific Corporation, BNSF Railway Company, Hub Group, Inc. and Schneider National, Inc., accounted for 31.6%.
The reliability of the two drayage legs rather than the line haul rate, since total transit and total cost decide the comparison and the drayage legs carry the appointment, chassis and detention exposure.
Report infographic
Market dynamics
15 factors across 5 forcesCost Advantage of Rail Over Road on Long Distance Movements
A train moves several hundred containers with one crew across a distance that would require hundreds of drivers by road, and the fuel consumed per container mile is a fraction of the road equivalent, so the cost per container falls as distance rises. The advantage is largest on movements beyond a thousand miles, where the fixed cost of the two drayage legs is spread across a long line haul, and it widens whenever diesel prices rise or driver wages increase. Shippers moving consistent volumes on long corridors therefore convert to intermodal for cost reasons alone, and the conversion holds through freight cycles because the underlying economics do not change with rate levels. This cost structure is the foundation of the intermodal and drayage services market. It also means the comparison against truckload is settled lane by lane rather than across a network, since a corridor long enough to absorb the two drayage legs converts and a shorter one does not.
Container Volumes Arriving at Ports That Must Move Inland
Every container discharged at a port has to reach an inland destination, and the movement from the terminal to a warehouse, a transload facility or a rail ramp is drayage whether or not a train is involved. The volume of that work grows with import activity rather than with rail conversion, so it provides demand that is independent of how intermodal competes against truckload. Port terminals also have limited space for containers to sit, which makes the speed of removal a condition of terminal operation rather than a shipper preference, and it sustains drayage demand even when inland freight volumes are weak. Growth in container throughput therefore translates almost directly into drayage revenue. Free time on the container adds urgency, because the equipment must be returned to the ocean carrier within a stated period and per diem accrues after it, so the movement cannot be deferred when inland capacity is short.
Emission Reduction Delivered by a Rail Movement
A rail movement produces materially lower greenhouse gas emissions than the same journey by road, and shippers reporting transport emissions can record the difference against a reduction target rather than only against a freight budget. ISO 14083:2023 establishes the methodology for quantifying and reporting transport chain emissions, so the saving can be stated on a basis that survives examination by a customer or an auditor. The reporting requirement has made intermodal a compliance instrument as well as a cost decision, and shippers increasingly set a proportion of freight to be moved by rail as a stated commitment. That commitment changes the basis of the comparison, because a lane that fails on cost alone can still be converted to meet the target. Shippers reporting to customers who themselves report also face the requirement at one remove, which extends it through supply chains rather than confining it to the largest organisations.
Conversion of Long Haul Truckload Freight to Intermodal
Shippers moving freight more than a thousand miles by truckload can convert the same lane to intermodal where the transit time permits, and the saving per container is large enough to justify the operational change. Domestic containers of fifty three feet carry the same payload as a road trailer, which removes the need to reconfigure loads, and dedicated intermodal services on high volume corridors have narrowed the transit time difference that previously ruled conversion out. Driver shortage in long haul truckload has strengthened the case further, because the capacity a shipper cannot secure by road is available by rail. Conversion is the mechanism by which the domestic container segment grows. The decision is usually taken lane by lane as contracts come up for tender rather than as a programme, which is why conversion continues steadily rather than arriving in steps.
Table of contents
11 chapters · 132 sections · 239 pages · click to expandSegmental analysis
By Service Type
- Intermodal line haul, with a share of 58.6% in 2026 at USD 75.01 billion.
- Drayage, at a CAGR of 7.8%, from USD 37.63 billion and a share of 29.4% in 2026.
- Domestic containers, with a share of 44.2% in 2026 at USD 56.58 billion.
- International containers, at a CAGR of 7.4%, from USD 54.53 billion and a share of 42.6% in 2026.
- Retail and consumer goods, with a share of 31.6% in 2026 at USD 40.45 billion.
- Chemicals, at a CAGR of 7.8%, from USD 11.01 billion and a share of 8.6% in 2026.
Geographic analysis
Asia-Pacific
Largest shareIn 2026, Asia-Pacific is expected to account for the largest share of 34.8% of the global intermodal and drayage services market, valued at USD 44.54 billion, and is also projected to register the highest CAGR of 8.4% during the forecast period. The region holds the largest share because its ports handle the greatest container volumes in the world and every container discharged generates an inland movement, which makes drayage demand a function of throughput rather than of rail conversion. The rapid growth is attributed to inland rail corridors extending into interior provinces and states that were previously served by road alone, to dedicated freight rail capacity being added where passenger traffic had limited it, and to container throughput rising faster than in any other region. Inland container depots are also being established away from the coast, which moves the drayage leg inland rather than removing it. China is projected to grow at a CAGR of 8.8% and India at 10.2%.
North America
North America follows with a share of 33.4% in 2026, valued at USD 42.75 billion, where the domestic container network is the most developed in the world and long inland corridors give rail its greatest cost advantage over road. The Surface Transportation Board proceeding in docket FD 36873 on the Union Pacific and Norfolk Southern application will determine whether a container can move coast to coast on one railroad rather than being interchanged at Chicago, and the transit time that interchange costs is what currently limits conversion from truckload on transcontinental lanes. The United States is projected to grow at a CAGR of 5.5% during the forecast period, with growth limited by the proportion of suitable long haul freight already converted and by drayage reliability rather than by rail capacity. Canada is served through the same corridors and the same equipment pools, so conditions move together across the border. European intermodal differs in that distances are shorter and the rail advantage is narrower, which places more of the regional revenue on drayage around ports than on line haul. Short sea and inland waterway services also carry containers that would move by rail elsewhere, which divides the European line haul between modes.
Latin America
Mexico, reported within Latin America, generates cross-border container drayage that uses the same ramps and operators.
Europe
Germany is projected to grow at a CAGR of 5.8% and the Netherlands and Belgium carry drayage volumes out of proportion to their size because of the port throughput concentrated there.
Competitive landscape
The competitive structure of the intermodal and drayage services market separates the parties that own track from the parties that sell the service. Union Pacific Corporation, BNSF Railway Company, Norfolk Southern Corporation, CSX Corporation, Canadian National Railway Company and Canadian Pacific Kansas City Limited operate the rail networks and sell intermodal capacity, while J.B. Hunt Transport Services, Inc., Hub Group, Inc., Schneider National, Inc., Knight-Swift Transportation Holdings Inc., C.H. Robinson Worldwide, Inc., RXO, Inc. and Loadsmart, Inc. sell intermodal and drayage service to shippers using that capacity, and A.P. Moller - Maersk A/S sells inland transport as part of a through ocean service.
Competition among the service sellers turns on container fleets, drayage capability at each ramp and the terms obtained from the railroads, rather than on the line haul itself, which is identical whoever sells it. The railroads hold the underlying asset and the service sellers hold the shipper relationship, so neither group can displace the other and the commercial tension between them concerns the division of the freight charge. BNSF Railway, CSX Transportation and a shipper coalition each moved for summary denial of the Union Pacific and Norfolk Southern application on 6 August 2026 and the Surface Transportation Board refused on 18 September 2026, which indicates how directly the competitive position of the remaining railroads turns on that proceeding. The 14 companies profiled accounted for 52.4% of the market in 2025, with the remainder held by regional drayage operators whose positions depend on proximity to a terminal and on appointment access rather than on scale, which is why consolidation has taken far less of this market than of the truckload and less-than-truckload markets beside it.
Some of the key players operating in the intermodal and drayage services market are J.B. Hunt Transport Services, Inc. (U.S.), Union Pacific Corporation (U.S.), BNSF Railway Company (U.S.), Hub Group, Inc. (U.S.), Schneider National, Inc. (U.S.), Norfolk Southern Corporation (U.S.), CSX Corporation (U.S.), Canadian National Railway Company (Canada), Canadian Pacific Kansas City Limited (Canada), A.P. Moller - Maersk A/S (Denmark), C.H. Robinson Worldwide, Inc. (U.S.), Knight-Swift Transportation Holdings Inc. (U.S.), RXO, Inc. (U.S.), and Loadsmart, Inc. (U.S.), among others.
- —
The Surface Transportation Board denied motions for summary denial of the Union Pacific and Norfolk Southern merger application on 18 September 2026 in docket FD 36873, having received those motions from BNSF Railway, CSX Transportation and a shipper coalition on 6 August 2026, and set opening comments on the merits for 18 November 2026 with responses due 16 February 2027.
- J.B. Hunt Transport Services, Inc. (U.S.)
- Union Pacific Corporation (U.S.)
- BNSF Railway Company (U.S.)
- Hub Group, Inc. (U.S.)
- Schneider National, Inc. (U.S.)
- Norfolk Southern Corporation (U.S.)
- CSX Corporation (U.S.)
- Canadian National Railway Company · Canada
- Canadian Pacific Kansas City Limited · Canada
- A.P. Moller - Maersk A/S · Denmark
- C.H. Robinson Worldwide, Inc. (U.S.)
- Knight-Swift Transportation Holdings Inc. (U.S.)
- RXO, Inc. (U.S.)
- Loadsmart, Inc. (U.S.)
Expert perspectives
The rail leg is the cheap and reliable part of an intermodal movement, and the drayage legs at either end decide whether the movement happens. Those two short truck legs carry the terminal appointments, the chassis dependency, the detention exposure and the gate delays, and a shipper comparing intermodal against truckload compares total transit and total cost rather than line haul rates. That is why intermodal loses lanes the cost comparison alone would have won, and why drayage grows faster than the line haul it is described as serving.
No party controls the asset chain on a drayage leg, and that rather than truck availability is the real constraint. The container belongs to the railroad or the ocean carrier, the chassis to an equipment provider or a pool, the tractor and driver to a drayage operator and the appointment to the terminal, so each optimises its own asset and a shortage in any one of them stops the movement. Chassis shortages have halted drayage at ports where trucks and drivers stood available, which is a problem no single party can invest its way out of.
The Union Pacific and Norfolk Southern proceeding is the most consequential open question in this market. Interchange at Chicago is where transcontinental intermodal loses the transit time that would otherwise make it competitive with truckload, and a single railroad on both sides of that handover would convert freight on transit time rather than on cost. The Surface Transportation Board refused summary denial on 18 September 2026 and set merits comments for 18 November 2026 with responses to February 2027, so the question will be argued rather than dismissed, and the competitive positions of the railroads that opposed it turn on the answer.
Drayage that serves ports rather than trains deserves to be assessed separately. Containers discharged at a terminal must reach an inland destination whether or not rail is involved, so that demand grows with throughput and is not exposed to the comparison between intermodal and truckload at all. Operators holding terminal proximity, appointment access and warehouse space within drayage distance capture the handling and the drayage either side of it, and those positions are local rather than national, which is why this market retains a large base of regional operators that scale has not displaced.
Growth in the intermodal and drayage services market rests on the cost advantage rail holds over distance and on the container volumes arriving at ports, and it is paced by drayage reliability, equipment provision and terminal appointment capacity. Operators holding specialised container capability, terminal proximity and the equipment the drayage leg depends on will take a disproportionate share of the increase, while the line haul itself competes on a cost basis that no seller differentiates.
Customer perspectives
Retail shippers evaluate intermodal on the reliability of the drayage legs rather than on the line haul rate, and that measure is what decides how much of the sector freight converts from truckload and how much returns to road after a failure, since the sector treats one bad lane as evidence about the mode rather than about the operator.
Chemical shippers buy qualified handling capability rather than price, which is why the segment holds firmer rates than general container freight across the industry and why it is the fastest-growing end user in this market, with contracts in the sector held longer than in any other segment and requalification treated as a cost to avoid rather than a routine step.
Shippers on transcontinental lanes across the sector hold freight on road because of the interchange rather than the price, which is the freight that becomes convertible if a single railroad can carry a container coast to coast, and it is the least rate-sensitive freight in the market because transit time rather than cost is what has kept it on road.
“The rail rate is not what we argue about. What our industry asks is what happens at the ramp, because a container sitting there waiting for a chassis has already cost us the saving the train delivered.”
“There are only so many operators who can handle a tank container and produce the cleaning certificate. Our sector pays above the market for that and we do not retender it often.”
“Coast to coast we still use trucks, because the container changes railroads in the middle and we cannot plan around what that costs us in days. If that changed, our industry would move a lot of this freight.”
Frequently asked questions
The market was valued at USD 119.00 billion in 2025 and USD 112.00 billion in 2024, and is estimated at USD 128.00 billion in 2026.
Cite this report
Meticulous Research. (2026). Intermodal and Drayage Services Market - Global Opportunity Analysis and Industry Forecast (2026-2036) (Report No. MRAUTO - 1042553). Meticulous Market Research Pvt. Ltd. https://www.meticulousresearch.com/product/intermodal-and-drayage-services-market-7236