Digital Freight Brokerage Market (2026-2036)
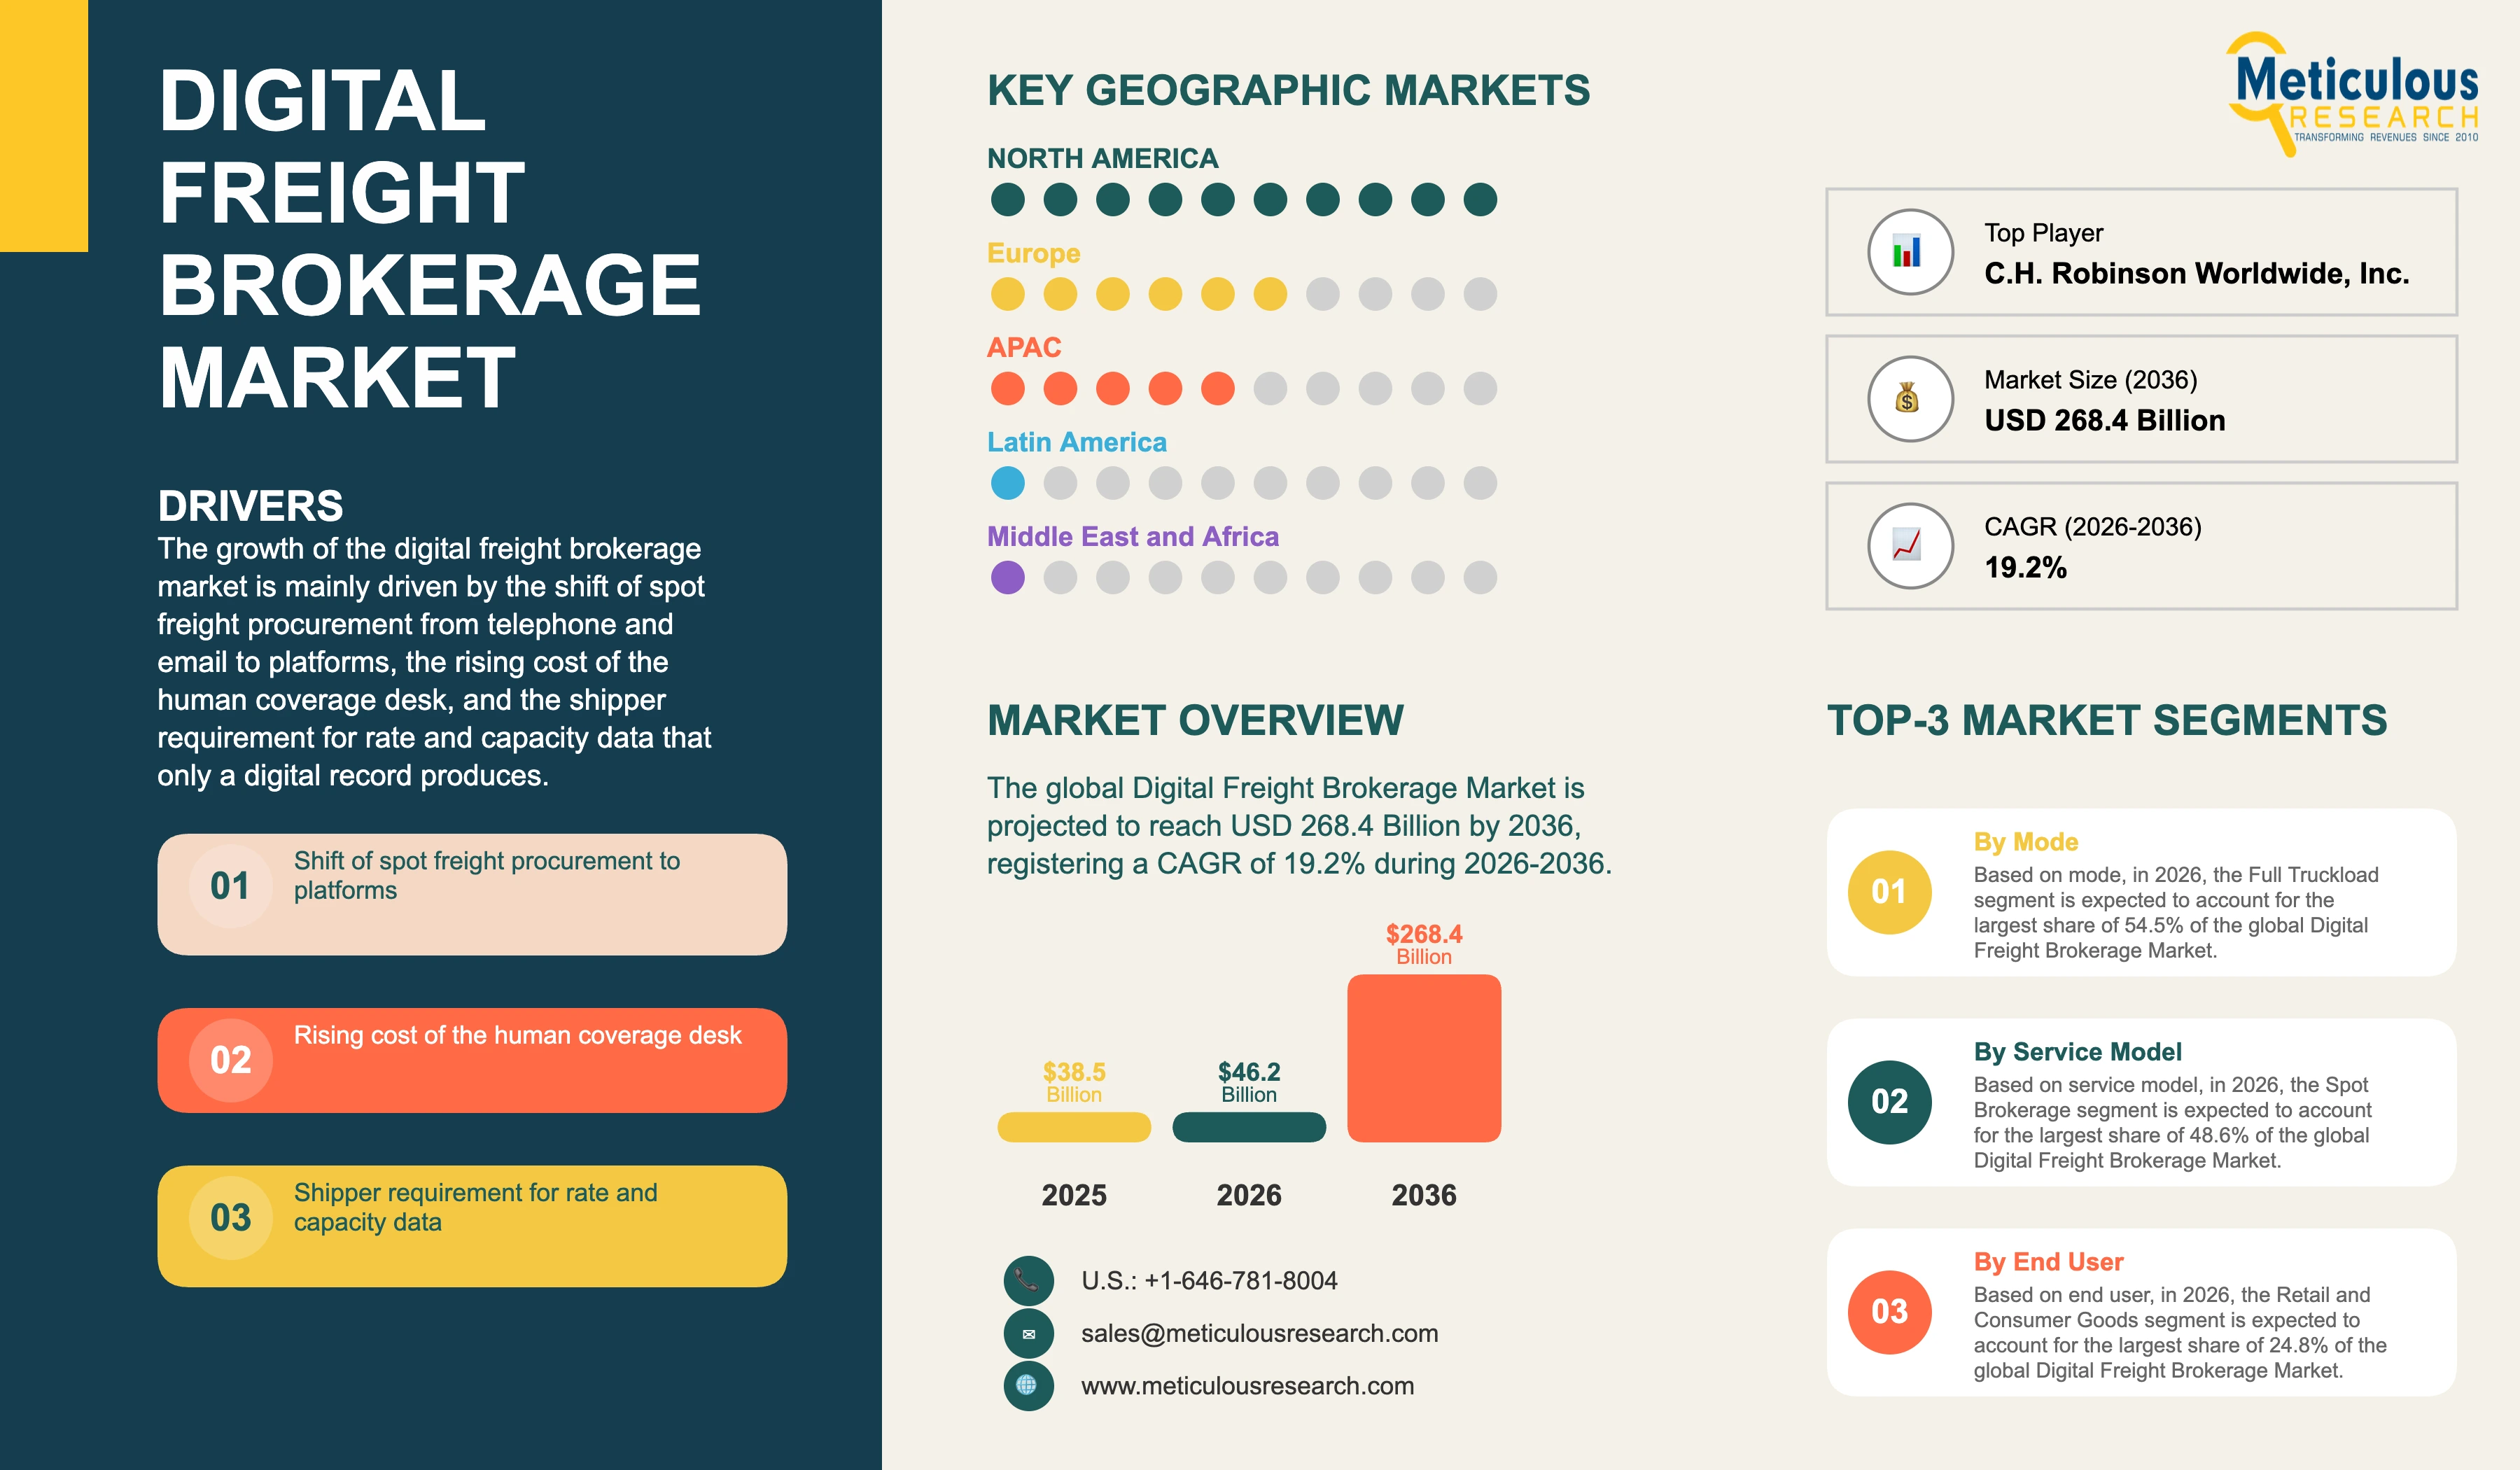
The global digital freight brokerage market was valued at USD 38.50 billion in 2025. This market is expected to reach USD 268.40 billion by 2036 from an estimated USD 46.20 billion in 2026, registering a CAGR of 19.2% during the forecast period (2026-2036).
- Published
- Nov 2026
- Pages
- 277
- Format
- PDF + Excel
- Report ID
- MRAUTO - 1042546
- Base year
- 2025
- 2025 · BASELINE
- $38.50B
- 2036
- $268.4B
- CAGR 2026–2036
- 19.2%
2025 baseline · 2026–2036 forecast at 19.2% CAGR · hover a bar for the value
Key highlights
The global digital freight brokerage market is estimated at USD 46.20 billion in 2026 and is projected to reach USD 268.40 billion by 2036.
Full truckload is expected to account for the largest share of 54.5% in 2026, while drayage is projected to register the highest CAGR of 23.4%.
Spot brokerage is expected to hold the largest share of 48.6% in 2026, while platform and software access is projected to grow fastest at a CAGR of 24.6%.
Retail and consumer goods is expected to be the largest end user with a share of 24.8% in 2026, while food and beverage is projected to register the highest CAGR of 21.8%.
North America is expected to hold the largest share of 44.6% in 2026, while Asia-Pacific is projected to register the highest CAGR of 22.9%.
A proposed United States rule published in November 2024 would require brokers to produce electronic transaction records within 48 hours of a request.
European Union authorities must accept freight data from certified electronic platforms from 9 July 2027.
sennder Technologies GmbH moves more than 150, 000 loads a month across more than 20 markets using a network of more than 40,000 vetted carriers.
Convoy ceased brokerage operations in 2023 and its technology was acquired by Flexport, Inc.
Transfix sold its brokerage business to NFI and now sells transportation management software.
Report summary
| Particulars | Details |
|---|---|
| Forecast Period | 2026-2036 |
| Base Year | 2025 |
| Estimated Year | 2026 |
| CAGR (Value) | 19.2% |
| Format | PDF, Excel & Cloud Portal · 277 pages |
| Market Size (Value) in 2025 | USD 38.50 billion |
| Market Size (Value) in 2026 | USD 46.20 billion |
| Market Size (Value) in 2036 | USD 268.40 billion |
| Segments Covered | Mode, Service Model, End User, and Geography |
| Modes Covered | Full Truckload, Less-Than-Truckload, Partial Truckload, Drayage, and Intermodal |
| Service Models Covered | Spot Brokerage, Contract and Dedicated Capacity, Managed Transportation, and Platform and Software Access |
| End Users Covered | Retail and Consumer Goods, Food and Beverage, Manufacturing and Industrial, Automotive, Building and Construction Materials, Chemicals and Energy, and Other End Users |
| Geographies Covered | North America, Europe, Asia-Pacific, Latin America, and Middle East & Africa |
| Companies Profiled | 14 leading players |
Report overview
Segments covered: mode, service model, end user.
The growth of this market is mainly driven by the shift of spot freight procurement from telephone and email to platforms that price and tender a load without a broker representative, the rising cost of the human coverage desk that platform matching removes from the transaction, the growing shipper requirement for rate and capacity data that only a digital record produces, and the extension of brokerage platforms from full truckload into less-than-truckload, drayage and intermodal. However, factors such as the thin and cyclical margin that a spot brokerage transaction earns, the carrier distrust created by margin opacity in platform transactions, the cost of carrier identity and fraud controls as double brokering losses rise, and the capital intensity of holding capacity commitments through a soft freight cycle are expected to restrain the growth of this market to some extent.
Freight brokerage places a shipment with a carrier that the broker does not own, and the broker earns the difference between what the shipper pays and what the carrier accepts. The work has historically been done by a person who holds relationships on both sides, calls to find a truck and negotiates a rate for each load, and the cost of that person sets the floor under the margin a broker needs. Digital freight brokerage replaces part of that sequence with software that quotes a price, offers the load to carriers that match the lane and equipment, and books the first acceptance, which lowers the cost of covering a load and allows the same desk to handle more loads a day.
A full truckload movement between two known points with standard dry van equipment can be priced from historical lane data and offered to a carrier list without a conversation, and platform penetration is highest on exactly that freight because the transaction software can replace is narrow. A refrigerated load with a delivery appointment, a drayage move tied to a container availability window, or a partial shipment that must be built into a multi-stop route involves conditions that sit outside a lane price, and coverage still requires a person for part of the sequence. The market therefore grows along two paths at once, with more loads moving to platforms within modes already digitised and new modes becoming addressable as appointment, container and dimensional data become available through interfaces.
Margin opacity is the structural feature that distinguishes brokerage from asset-based transport. The carrier that accepts a load on a platform usually does not see the rate the shipper paid, and the broker margin is the difference. The federal motor carrier safety administration published a proposed rule titled transparency in property broker transactions at 89 fr 91648 on 20 november 2024 under docket no. fmcsa-2023-0257 and rin 2126-ac63, with the comment period closing on 21 january 2025. Under that proposal, the proposal would require a property broker to keep the transaction records described at section 371.3(a) of Title 49 of the Code of Federal Regulations in electronic form, with each charge and fee shown by amount and description, any penalty tied to the shipment, the dates of payment from shipper to broker and from broker to carrier, and any claim connected to the shipment, and to provide those records within 48 hours of a request from a party to the transaction. The practical consequence is a records duty rather than a disclosure duty, because the proposal would also remove the definition of non-brokerage service from section 371.2, and it does not prohibit a broker from including a confidentiality clause in a carrier agreement.
A broker that already holds every charge, fee, payment date and claim in a system can answer a records request at close to no marginal cost, while a broker that holds the same information across email threads, spreadsheets and accounting entries cannot. The cost of compliance therefore falls unevenly across the same licensed population, and the burden is heaviest on the small brokers who place the majority of loads by count. That is the mechanism by which a transparency measure becomes a systems requirement, and it favours the platforms that were built around a complete electronic record of the transaction.
The European path to the same outcome runs through document acceptance rather than margin records. Regulation (eu) 2020/1056 on electronic freight transport information entered into force in august 2020 and applies in full from 9 july 2027, from which point competent authorities in every member state must accept freight transport data when a business shares it through a certified efti platform, and the first implementing and delegated acts entered into force in January 2025, platforms and service providers can prepare for operation from January 2026 and authorities may begin accepting data held on certified platforms from that month, with the remaining implementing specifications planned for adoption by December 2026. Acceptance sits with the authority rather than with the operator, so a carrier or broker is not compelled to digitise, and the gain from doing so is commercial. A consignment that travels with data on a certified platform can be checked at the roadside without paper, which shortens the stop and removes the administrative return of signed delivery notes, and an operator that keeps paper carries that cost for as long as it chooses to.
Fraud has become the operating constraint that platform brokers manage most actively. Double brokering, where a carrier accepts a load and re-brokers it to a third party without authority, moves the liability for cargo loss to a broker that has no contract with the party actually holding the freight, and identity theft of legitimate carrier authorities makes a clean record check insufficient on its own. The response has moved from document collection at onboarding to continuous verification at tender, including device and location checks against the truck that accepted the load, and the cost of those controls now sits inside the cost of covering a load rather than in a separate compliance function.
Capacity cycles set the revenue line more sharply here than in most transport markets. When trucks are plentiful, spot rates fall, shipper freight returns to contract and the volume available to brokers shrinks at the same time as the margin per load widens. When capacity tightens, routing guides fail, freight moves to the spot market in volume and brokers carry high revenue at compressed margin. A platform changes the cost of serving each load but it does not change this cycle, which is why the market is better read through loads handled and net revenue per load than through gross revenue alone.
North America, with a share of 44.6% in 2026 at USD 20.60 billion, with the United States growing at a CAGR of 17.1%.
Asia-Pacific, at a CAGR of 22.9%, with India at 24.6% and China at 23.2%.
Europe holds a share of 26.3% in 2026 at USD 12.15 billion and is projected to grow at a CAGR of 19.2%, with Germany at 18.9%.
The Middle East & Africa holds 3.4% at USD 1.57 billion with a CAGR of 20.1%, and Latin America holds 4.3% at USD 1.99 billion with a CAGR of 21.4%, with Brazil at 21.8%.
The 14 companies profiled accounted for 47.8% of the market in 2025, and the top five players, C.H. Robinson Worldwide, Inc., RXO, Inc., Uber Technologies, Inc., J.B. Hunt Transport Services, Inc. and Total Quality Logistics, LLC, accounted for 31.4%.
Platform and software access, at a CAGR of 24.6%, from USD 3.93 billion and a share of 8.5% in 2026.
Retail and consumer goods, with a share of 24.8% in 2026 at USD 11.46 billion.
Food and beverage, at a CAGR of 21.8%, from USD 8.45 billion and a share of 18.3% in 2026.
Report infographic
Market dynamics
15 factors across 5 forcesShift of Spot Freight Procurement From Telephone and Email to Platforms
Spot freight has moved onto digital freight matching platforms because the sequence that produces a covered load can be written down. A shipper that posts a lane, equipment type and pickup window receives a price that was calculated from historical movements on that lane, accepts or declines it, and the load is offered to carriers whose equipment and operating area match the requirement. The absence of a negotiation removes the cost of a representative from both sides of the transaction, and it also removes the delay, because an offer can be made to several thousand carriers at once rather than in sequence. Shippers that run high volumes of repeatable lanes have moved the majority of their spot tenders to this route, and brokers that kept the telephone sequence for the same freight carry a cost per load that the price no longer supports. The share of loads that can be handled this way rises as lane history accumulates, so the platform position compounds rather than being won once.
Rising Cost of the Human Coverage Desk
A coverage representative at a traditional freight broker can work a limited number of loads in a day, and the number falls as each load requires more calls. Wage growth in logistics roles and the turnover rates typical of brokerage desks mean that the cost of the capacity to cover a load has risen while the brokerage margin per load has not. Automating the offer and acceptance step raises the loads a person can oversee by an order of magnitude on simple freight, which turns a cost that scaled with volume into one that scales with exceptions. The brokers that have made this change report a materially lower cost to serve on digital lanes, and the saving is what funds the price they can quote a shipper. The pressure applies to every broker regardless of size, which is why platform adoption has spread from the largest firms into the mid-market rather than remaining a scale advantage. Brokers that retained the manual sequence on simple freight now carry two costs at once, the representative on the load and the lost volume on lanes where a platform quoted faster.
Shipper Requirement for Rate and Capacity Data
Transportation procurement has become a data exercise rather than a relationship exercise, and this is the condition that has pulled shippers toward digital freight brokerage platforms. A shipper that runs an annual bid needs rate history by lane, acceptance rates against routing guides, tender lead times and performance by carrier, and none of that exists in a usable form unless the transactions were recorded electronically as they happened. Brokers that operate platforms produce this record as a by-product of the transaction, and they can return it to the shipper as a service, which creates a reason for the shipper to concentrate volume rather than spread it across many brokers to test pricing. The same record supports the shipper obligation to report transport emissions, because distance, equipment and weight by movement are recorded at the load level. Data that was once a differentiator has become a condition of holding the business.
Extension of Brokerage Platforms Into Less-Than-Truckload, Drayage and Intermodal
Truckload brokerage was digitised first because the price depends on little more than origin, destination, equipment and date. Less-than-truckload pricing requires dimensional and class data and carrier tariff logic, drayage requires container availability and terminal appointment data, and intermodal requires ramp capacity and dray legs at both ends, and all three have become accessible through interfaces that carriers and terminals now expose. As those inputs arrive, the same matching and pricing engine extends to modes that were previously quoted manually, and a broker can serve more of a shipper transport spend from one platform rather than handing the complex modes to a different desk. The addressable volume therefore grows faster than truckload freight alone.
Table of contents
11 chapters · 131 sections · 277 pages · click to expandSegmental analysis
| Segment | Largest share (2026) | Fastest growth (2026–2036) |
|---|---|---|
| By Mode | Full truckload | Rapid growth of this |
| By Service Model | Spot brokerage | Rapid growth of this |
| By End User | Retail and consumer goods | Rapid growth of this |
By Mode
- Digital Freight Brokerage Market Analysis by Mode
- The full truckload segment is expected to account for the largest share of 54.5% of the global digital freight brokerage market, valued at USD 25.18 billion.
- The large share of this segment is mainly due to the simplicity of the pricing problem, because a dry van movement between two points on a known date can be priced from lane history without human judgement, and the load volume on repeatable lanes is high enough to support automated matching at scale.
- Full truckload is also the mode in which shipper spot tendering was already established before platforms existed, so the freight was transacted in a form that software could take over without changing how the shipper buys.
- Truckload brokerage carries the deepest carrier population as well, which means an offer reaches enough trucks for the first acceptance to arrive within minutes.
- Dry van equipment is interchangeable between loads, so a platform can treat capacity as a pool rather than as a set of individual relationships, and that is what allows a single desk to oversee volumes a telephone desk could not.
- However, the drayage segment, valued at USD 4.30 billion in 2026 and accounting for a share of 9.3%, is projected to register the highest CAGR of 23.4% during the forecast period.
- The rapid growth of this segment is attributed to the recent availability of terminal appointment, container availability and chassis data through interfaces, which allows a drayage brokerage platform to price a move against the window in which the container can actually be collected rather than against an average.
- The cost of failure in this mode is also high, because demurrage and detention charges exceed the dray rate itself when a move is missed, so shippers pay for coverage certainty rather than for the lowest rate.
- Port congestion raises that value rather than reducing it, which gives the segment demand through the freight cycle.
- Drayage also sits inside an international movement that the shipper already tracks, so the record a platform produces fills a gap between the ocean leg and the inland leg that neither the ocean carrier nor the inland carrier reports on.
- Full truckload, with a share of 54.5% in 2026 at USD 25.18 billion.
- Drayage, at a CAGR of 23.4%, from USD 4.30 billion and a share of 9.3% in 2026.
By Service Model
- Digital Freight Brokerage Market Analysis by Service Model
- The spot brokerage segment is expected to account for the largest share of 48.6% of the global digital freight brokerage market, valued at USD 22.45 billion.
- The large share of this segment is mainly due to the nature of the freight it addresses, because a spot load carries no prior commitment and can be priced and offered without reference to a contract, which is the transaction software replaces most completely.
- Shippers also use the spot market to cover routing guide failures at short notice, where automated coverage holds a clear time advantage over a telephone sequence, and the volume released into the spot market rises whenever contracted carriers decline tenders.
- The absence of a commitment on either side is what keeps this segment largest, because a spot load can be placed with any carrier that accepts the price and the broker carries no obligation beyond the single movement.
- However, the platform and software access segment, valued at USD 3.93 billion in 2026 and accounting for a share of 8.5%, is projected to register the highest CAGR of 24.6% during the forecast period.
- The rapid growth of this segment is attributed to brokers licensing the pricing, tendering and record systems they built for internal use to shippers and to other brokers, and to the records duty proposed in the United States, which would require every licensed property broker to hold transaction detail in a form that can be produced on request.
- Revenue here is contracted per user or per load rather than earned as a share of a freight transaction, so it does not fall when freight rates fall, and the brokers that hold both lines use it to steady earnings through the cycle.
- The firms buying this software are mostly small and mid-sized brokers that place a large share of loads by count and hold no system capable of producing the transaction detail, which is a far wider base of buyers than the shipper platform market.
- Spot brokerage, with a share of 48.6% in 2026 at USD 22.45 billion.
By End User
- Digital Freight Brokerage Market Analysis by End User
- The retail and consumer goods segment is expected to account for the largest share of 24.8% of the global digital freight brokerage market, valued at USD 11.46 billion.
- The large share of this segment is mainly due to the volume and repeatability of its freight, because replenishment moves between distribution centres and stores run on known lanes at predictable frequencies, which is the condition under which automated pricing performs best.
- Seasonal peaks also force retailers into the spot market in volume at the points in the year when routing guides fail, and the scale of that requirement is beyond what a telephone desk can cover in the time available.
- Retail freight also carries delivery appointment windows at distribution centres, so coverage has to be secured early enough to meet the window rather than at the lowest rate found on the day.
- However, the food and beverage segment, valued at USD 8.45 billion in 2026 and accounting for a share of 18.3%, is projected to register the highest CAGR of 21.8% during the forecast period.
- The rapid growth of this segment is attributed to temperature-controlled capacity being scarcer and more volatile in price than dry van capacity, which raises the value of reaching every available carrier at once, and to delivery appointments at retail distribution centres that make coverage certainty worth more than the rate.
- Traceability requirements add a further reason, because an electronic record of each movement serves the food safety function as well as the transport function.
- Food and beverage shippers run shorter planning horizons than most industries because the product has a shelf life, which keeps a larger proportion of their freight in the spot market where platforms hold the advantage.
Geographic analysis
North America
Largest shareIn 2026, North America is expected to account for the largest share of 44.6% of the global digital freight brokerage market, valued at USD 20.60 billion. The region holds this position because brokerage is an established and licensed intermediary function in the United States with a large population of authorised property brokers, and because the truckload market is deep and fragmented enough that matching software has material value. The proposed records duty is pushing transaction detail into electronic systems across the whole licensed population, which favours the platforms already built around a complete electronic record. The United States is projected to register a CAGR of 17.1% during the forecast period, with growth moderated by the maturity of digital truckload adoption among large shippers. The region also holds the deepest spot market, because contracted routing guides cover a smaller share of freight here than in Europe, and the volume that falls through to spot is what platforms compete for.
Asia-Pacific
Fastest growthHowever, Asia-Pacific is projected to register the highest CAGR of 22.9% during the forecast period. The rapid growth of this region is attributed to domestic road freight in China and India moving from informal brokerage arrangements to platform transactions, which brings volume that was never recorded electronically into the measured market for the first time. Carrier populations here are more fragmented than in any other region, so the matching advantage a platform holds is larger, and digital freight matching reaches shippers who never had a brokerage relationship at all rather than displacing one that existed. Manufacturing export flows add drayage brokerage and intermodal demand around the region ports, and India is projected to grow at a CAGR of 24.6%. Smartphone reach among carrier drivers is also higher than back-office system adoption, so platforms can onboard capacity directly without the carrier holding any transport software of its own.
Competitive landscape
The competitive structure of the digital freight brokerage market places asset-light brokers that built platforms against asset-based carriers that added brokerage, and against technology firms that entered the transaction. C.H. Robinson Worldwide, Inc. operates the largest brokerage network and runs it on the Navisphere platform, RXO, Inc. separates capacity solutions from managed services in its offering, and J.B. Hunt Transport Services, Inc. and Schneider National, Inc. brought their own fleets alongside brokered capacity. Uber Technologies, Inc. entered through Uber Freight and now presents capacity and managed transportation as its two solution groups, while Flexport, Inc. acquired the technology of Convoy after that business ceased brokerage operations in 2023.
Asset-based carriers and large brokers have bought books of business and carrier networks over the last three years, with sennder Technologies GmbH acquiring the European road freight business of C.H. Robinson Worldwide, Inc., and firms that could not sustain brokerage margin have sold the operation and kept the software, as Transfix did when it sold its brokerage business to NFI. The firms that remain compete on cost to cover a load, on carrier acceptance rates and on the quality of the record they return to the shipper rather than on price alone. Carrier acceptance rate has become the operating measure that separates them, because a platform that carriers decline first when capacity tightens pays more to cover the same load. Technology firms without a licensed brokerage operation have largely moved to supplying brokers rather than competing with them, which has narrowed the field of direct competitors while widening the supplier base behind it, and the suppliers now sell carrier verification, pricing data and transaction systems to the same brokers they once competed against.
Some of the key players operating in the digital freight brokerage market are C.H. Robinson Worldwide, Inc. (U.S.), RXO, Inc. (U.S.), Uber Technologies, Inc. (U.S.), J.B. Hunt Transport Services, Inc. (U.S.), Total Quality Logistics, LLC (U.S.), Echo Global Logistics, Inc. (U.S.), Landstar System, Inc. (U.S.), Schneider National, Inc. (U.S.), Werner Enterprises, Inc. (U.S.), Flexport, Inc. (U.S.), Loadsmart, Inc. (U.S.), Arrive Logistics, LLC (U.S.), Shipwell, Inc. (U.S.), and sennder Technologies GmbH (Germany), among others.
- —
sennder Technologies GmbH acquired the European road freight business of C.H. Robinson Worldwide, Inc., Flexport, Inc. acquired the technology of Convoy after that business ceased brokerage operations in 2023, and Transfix sold its brokerage business to NFI and moved to licensing transportation management software.
- C.H. Robinson Worldwide, Inc. (U.S.)
- RXO, Inc. (U.S.)
- Uber Technologies, Inc. (U.S.)
- J.B. Hunt Transport Services, Inc. (U.S.)
- Total Quality Logistics, LLC (U.S.)
- Echo Global Logistics, Inc. (U.S.)
- Landstar System, Inc. (U.S.)
- Schneider National, Inc. (U.S.)
- Werner Enterprises, Inc. (U.S.)
- Flexport, Inc. (U.S.)
- Loadsmart, Inc. (U.S.)
- Arrive Logistics, LLC (U.S.)
- Shipwell, Inc. (U.S.)
Expert perspectives
The margin in the digital freight brokerage market rests on the carrier not knowing the shipper rate, and the regulatory change now in progress in the United States does not remove that condition. A broker would have to produce the transaction detail within 48 hours of a request under the proposed rule, but confidentiality clauses in carrier agreements would remain available, so the information becomes obtainable rather than open. What changes is the cost of being able to answer, and that cost is near zero for a broker whose transactions were electronic from the start and significant for one whose records sit across email and spreadsheets.
Spending will follow that asymmetry into transaction systems rather than into matching engines. The brokers who already match loads automatically have the record as a by-product, and the firms that need to buy something are the small and mid-sized brokers who place most loads by count and hold no system capable of producing charges, fees, payment dates and claims on demand. The licensing of brokerage software by firms that built it for their own desks is the supply response to that demand, and it is why the platform and software line grows faster than the brokerage line it came from.
Field performance rather than platform capability is what compounds for a company entering or expanding in this market. Carrier acceptance rates determine the cost of covering a load, and they are earned by paying promptly, pricing consistently and not being the broker that carriers decline first when capacity tightens. Fraud losses determine whether the lower cost to serve survives contact with the market, and the controls that prevent them sit at every tender rather than at onboarding. Neither is visible in a product demonstration.
The United States rule is still a proposal and carries no fixed compliance date, so the direction of the software demand it creates is clearer than its timing. Gross revenue in brokerage moves with freight rates rather than with digital penetration, which allows a soft cycle to shrink reported revenue while the share of loads transacted digitally keeps rising, and the digital freight brokerage market is therefore read more reliably through loads handled and net revenue per load. European acceptance of electronic freight data falls on authorities rather than on operators, leaving adoption there a commercial decision that can run slower than the July 2027 date implies. The failure of well-capitalised digital brokers during the last soft cycle showed that a lower cost per load does not substitute for a revenue line the market sets.
Growth in this market rests on the volume of freight that can be priced and covered without a conversation, and it is paced by the freight cycle and by the records obligations that are being written now. Suppliers that hold a complete electronic record of each transaction, maintain carrier acceptance through the cycle and sell the record as a service rather than only the coverage will take a disproportionate share of the increase.
Customer perspectives
Head of Logistics Procurement - consumer goods industry
Our industry buys transport on an annual bid and lives with the routing guide for a year, so what we value from a digital freight brokerage platform is not the rate on one load. It is knowing which lanes failed and why, before the next bid, because that is where the money is.
Consumer goods shippers run high volumes on repeatable lanes, so retention in this industry rests on the record a freight brokerage platform returns rather than on the price of an individual movement, and procurement teams concentrate volume with the brokers who supply it.
Owner - small fleet road haulage sector
In our part of the industry trust decides where the trucks go. The platforms that pay on the terms they promised and do not let a load be passed on to somebody else get our capacity first when freight is tight, and that is the only loyalty this business has.
Carrier acceptance is the operating cost in this market, and in the small fleet sector it is earned through payment behaviour and clarity over who holds the freight, which is why fraud control has become a commercial instrument rather than a compliance function.
Supply Chain Director - automotive sector, cross-border operations
Automotive runs to a production schedule, so a late trailer stops a line and the freight rate stops being the issue. We need one party accountable for the whole cross-border movement, and that is a different service from the brokerage our industry bought ten years ago.
Automotive and other schedule-driven industries buy accountability for the complete movement rather than coverage of individual legs, and this is the requirement pulling managed transportation services and cross-border capability into the digital freight brokerage market, and it is why these industries pay above the brokerage rate for a single accountable party.
Frequently asked questions
The market was valued at USD 38.50 billion in 2025 and USD 32.10 billion in 2024, and is estimated at USD 46.20 billion in 2026.
Cite this report
Meticulous Research. (2026). Digital Freight Brokerage Market - Global Opportunity Analysis and Industry Forecast (2026-2036) (Report No. MRAUTO - 1042546). Meticulous Market Research Pvt. Ltd. https://www.meticulousresearch.com/product/digital-freight-brokerage-market-7229