Specialty Glass for Displays Market (2026-2036)
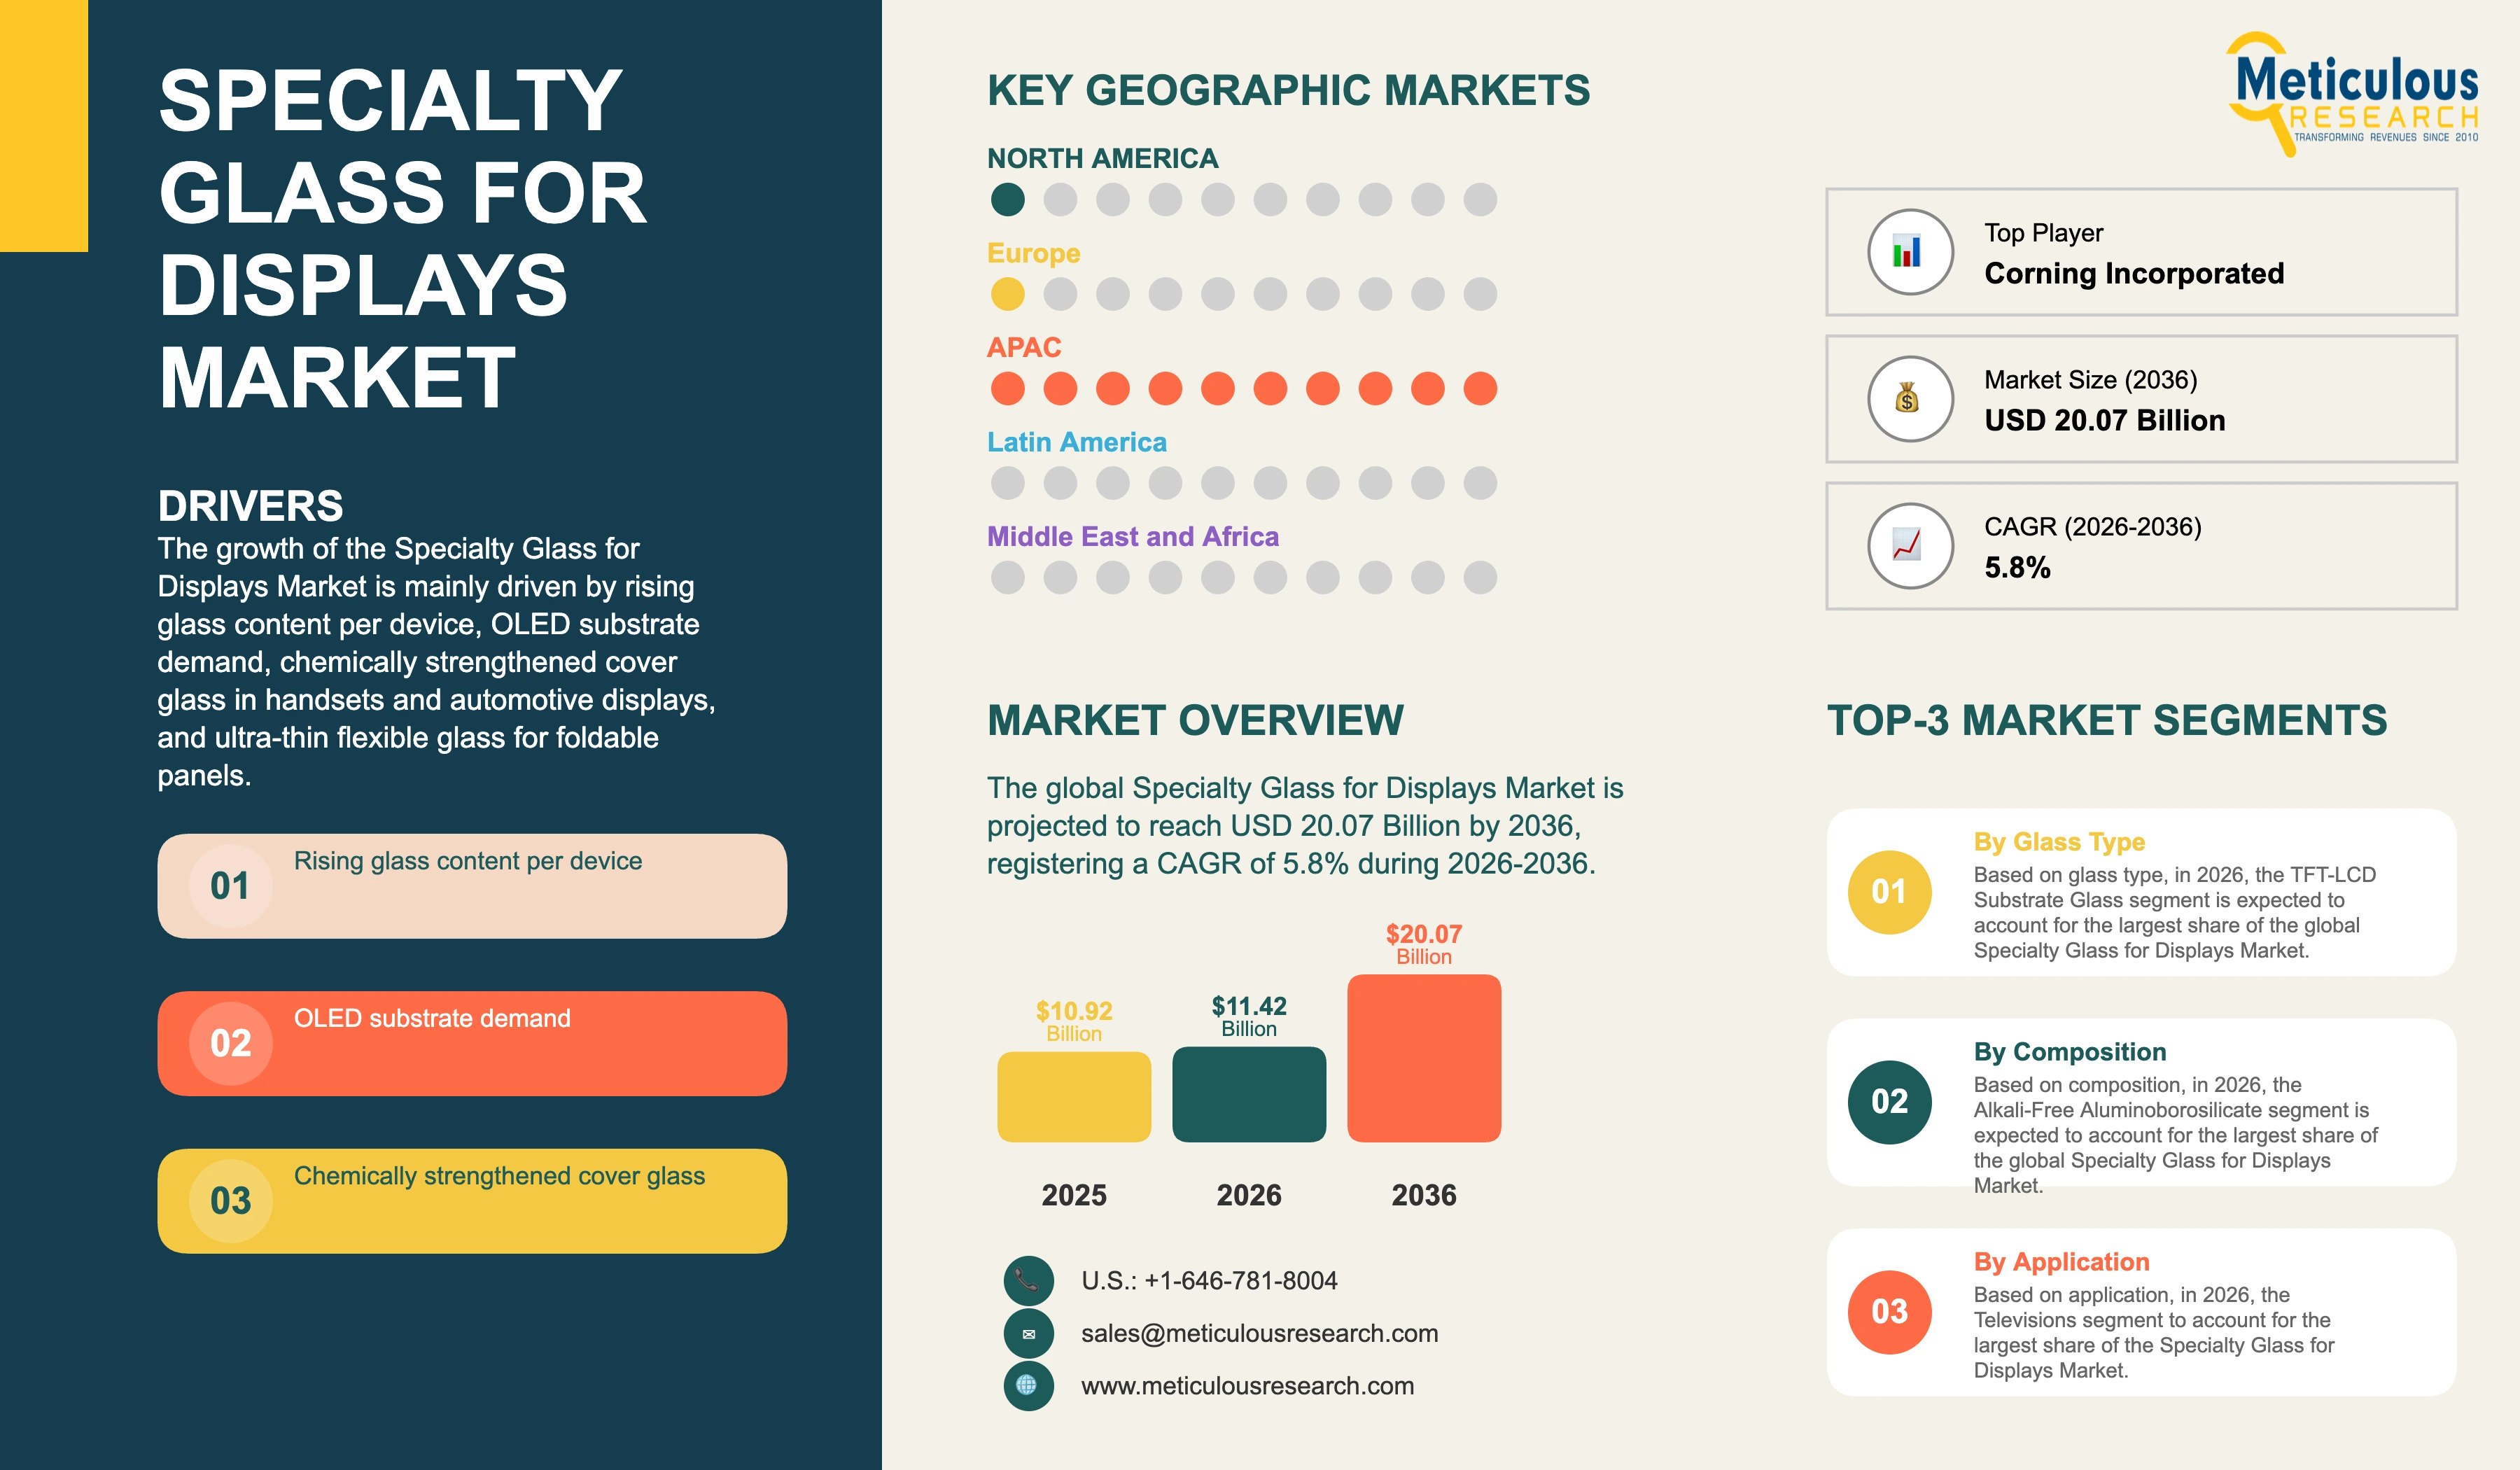
The specialty glass for displays market is valued at USD 11.42 billion in 2026 and is projected to reach USD 20.07 billion by 2036, at a CAGR of 5.8% during the forecast period. The market was valued at USD 10.92 billion in 2025 and at USD 11.09 billion in 2024.
- Published
- Nov 2026
- Pages
- 258
- Format
- PDF + Excel
- Report ID
- MRCHM - 1042744
- Base year
- 2025
- 2024 · HISTORICAL
- $11.09B
- 2036
- $20.07B
- CAGR 2026–2036
- 5.8%
2024–2025 baseline · 2026–2036 forecast at 5.8% CAGR · hover a bar for the value
Key highlights
This market measures specialty glass supplied for display applications at the glass maker gate, covering TFT-LCD and OLED substrate glass, chemically strengthened cover glass and ultra-thin flexible glass, on a shipped area basis.
The value base is soft rather than rising smoothly. Value fell 1.5% between 2024 and 2026 before recovering, so the headline rate measured from the 2026 base overstates the trend. Measured from the 2024 actual, the market grows at 5.1% a year to 2036, and that is the better guide.
Corning combined its Display Technologies and Specialty Materials segments into a single Glass Innovations segment effective from the first quarter of 2026, with prior periods recast, which placed display substrate glass and cover glass under one reporting line for the largest producer.
Glass Innovations recorded net sales of USD 1, 506 million in the third quarter of 2026, 3% above the second quarter but 3% below the USD 1,560 million of the third quarter of 2025, with net income of USD 328 million against USD 363 million, a decline of 10%.
That performance was described as outperforming the television unit, notebook and smartphone markets, which memory pricing has affected, so the glass content strategy grew against device markets that did not.
Currency carries a material part of reported revenue for the largest producer. The third quarter 2026 hedge rate was 120 yen, with 94% of yen exposure hedged, and the company-wide hedged exposure adjustment to net sales was USD 226 million in that quarter.
AGC reported Electronics segment net sales of 355.1 billion yen for the year ended 31 December 2025, down 9.5 billion yen or 2.6% year on year, with operating profit down 12.7% to 47.5 billion yen.
Display sales within that segment rose on higher shipments of LCD glass substrates, while photomask blank shipments for extreme ultraviolet lithography declined.
The same company decided to withdraw from the business in specialty glass for chemical strengthening, and the costs of that decision contributed to the segment profit decline, which is direct counter-evidence to the assumption that cover glass material supply is expanding.
AGC guided Electronics sales higher but profits lower for 2026, with LCD glass substrate shipments expected to decline slightly and earnings improvement measures planned, so the largest volume-bearing glass type is forecast to contract at one of the three established producers.
CNBM New Material Research Institute produces 30 micrometre ultra-thin flexible glass, about a third the thickness of a sheet of A4 paper, which entered mass production in 2021 and withstands more than one million folds without cracking.
The same institute produces 8.5-generation TFT-LCD glass substrates, each about the area of six 50-inch televisions, which is the scale at which substrate economics are set.
Bengbu, where that work is concentrated, holds 17 national level innovation platforms and is building a glass and new materials industrial cluster targeted at 100 billion yuan, about USD 14.7 billion.
Glass melting for displays cannot follow demand once built, because a float or fusion tank is committed to a generation size and a location for its campaign life, which is why 86% of this market sits in Asia-Pacific alongside the panel fabs it feeds.
Among compositions, alkali-free aluminoborosilicate is expected to hold the largest share in 2026, while other glass compositions are expected to grow fastest.
Among applications, televisions are expected to hold the largest share in 2026, while automotive displays are expected to grow fastest.
The five companies profiled hold 78.5% of this market in 2026, which makes it the most concentrated title in this series.
Report summary
| Particulars | Details |
|---|---|
| Base Year | 2025 |
| Actual Years | 2024-2025 |
| Forecast Period | 2026-2036 |
| Market Size (Value) in 2024 | USD 11.09 billion |
| Market Size (Value) in 2025 | USD 10.92 billion |
| Market Size (Value) in 2026 | USD 11.42 billion |
| Market Size (Value) in 2036 | USD 20.07 billion |
| CAGR (Value) | 5.8% |
| Format | PDF, Excel & Cloud Portal · 258 pages |
| Value CAGR from 2024 Actual | 5.1% a year to 2036; value fell 1.5% between 2024 and 2026, so the rate measured from the 2026 base overstates the trend |
| Volume in 2025 | 721.00 million square metres |
| Volume in 2026 | 745.00 million square metres |
| Volume in 2036 | 1,041.00 million square metres |
| Volume CAGR (2026-2036) | 3.4% |
| Average Selling Price, 2026 | USD 15.33 per square metre |
| Average Selling Price, 2036 | USD 19.28 per square metre |
| Units | Value in USD million; volume in million square metres of glass; price in USD per square metre |
| Measurement Basis | Specialty glass supplied for display applications at the glass maker gate, covering TFT-LCD and OLED substrate glass, chemically strengthened cover glass and ultra-thin flexible glass, on a shipped area basis |
| Exclusions | The finished display panel, module and assembly; polarisers, colour filters and driver electronics; coatings applied to the glass; glass core substrates for semiconductor packaging; photomask blanks for lithography; architectural, container and automotive glazing; transparent polyimide and other polymer cover materials |
| Segments Covered: Glass Type | TFT-LCD Substrate Glass; OLED Substrate Glass; Cover Glass; Ultra-Thin and Flexible Glass |
| Segments Covered: Composition | Alkali-Free Aluminoborosilicate; Aluminosilicate; Other Glass Compositions |
| Segments Covered: Application | Televisions; Smartphones; Notebooks and Monitors; Tablets and Wearables; Automotive Displays; Other Displays |
| Largest Segment by Glass Type, 2026 | TFT-LCD Substrate Glass |
| Fastest-Growing Segment by Glass Type | Ultra-Thin and Flexible Glass, at 13.0% |
| Largest Segment by Composition, 2026 | Alkali-Free Aluminoborosilicate |
| Fastest-Growing Segment by Composition | Other Glass Compositions, at 9.8% |
| Largest Segment by Application, 2026 | Televisions |
| Fastest-Growing Segment by Application | Automotive Displays, at 10.8% |
| Largest Region, 2026 | Asia-Pacific, at 86.0% |
| Fastest-Growing Region | Middle East & Africa, at 8.4% |
| Fastest-Growing Country | India, at 9.4% |
| Slowest-Growing Country | Japan, at 4.2% |
| Regions Covered | Asia-Pacific; Europe; North America; Latin America; Middle East & Africa |
| Countries Covered | China; South Korea; Taiwan; Japan; India; Germany; U.S.; Mexico; Brazil; Saudi Arabia |
| Key Companies | Corning Incorporated; AGC Inc.; Nippon Electric Glass Co., Ltd.; SCHOTT AG; China National Building Material Group Co., Ltd. |
| Top Five Share, 2026 | 78.5% |
| Profiled Companies Share, 2026 | 78.5% |
| Currency | USD |
Report overview
Market value is measured in in USD million; volume in million square metres of glass; price in USD per square metre. Segments covered: glass type, composition, application.
In volume terms, the market is estimated at 745.00 million square metres of glass in 2026, rising to 1,041.00 million square metres by 2036, at a CAGR of 3.4%. The average selling price is estimated at USD 15.33 per square metre in 2026 and USD 19.28 per square metre in 2036, the increase reflecting a shift in the mix from large-area TFT-LCD substrate toward cover glass, OLED substrate and ultra-thin flexible glass, each of which carries a substantially higher value per square metre.
The growth of this market is mainly driven by rising glass content per device, OLED substrate demand, chemically strengthened cover glass in handsets and automotive displays, and ultra-thin flexible glass for foldable panels. However, factors such as device unit markets affected by memory pricing, declining large-area substrate shipments, exits from chemically strengthened specialty glass, and melting capacity that cannot be relocated once built are expected to restrain the growth of this market to some extent.
Among glass types, TFT-LCD substrate glass is expected to hold the largest share of this market in 2026, while ultra-thin and flexible glass is expected to record the highest CAGR during the forecast period. Geographically, Asia-Pacific is expected to account for the largest share of this market in 2026, while the Middle East & Africa is expected to register the highest CAGR during the forecast period.
Specialty glass for displays is a family of precisely flat, chemically specified glasses melted and formed to thickness tolerances far tighter than architectural or container glass. Substrate glass carries the thin film transistor array and must survive repeated photolithography and annealing without distortion, so it is alkali-free to prevent sodium migration into the silicon layer and is held to total thickness variation measured in micrometres across sheets the size of several television screens.
Two forming routes dominate. The fusion draw process forms glass by overflowing a trough so that neither surface touches a roller or a bath, giving a pristine finish without polishing and setting the quality standard for the highest generations. The float route, adapted with higher precision controls and tighter annealing, serves the same application at lower capital cost but requires surface finishing for the most demanding specifications, which adds a conversion step and a yield loss that the fusion route avoids.
Generation size governs the economics. An 8.5-generation substrate is about the area of six 50-inch televisions, and a tank is committed to a generation and a site for its campaign life, so melting capacity cannot follow demand once built. That is why 86% of this market sits in Asia-Pacific, within road distance of the panel fabs it feeds, and why a glass maker commits capital years before the panel maker commits to a product.
Cover glass is the second major class and follows a different logic. It is an aluminosilicate composition formed thin, then chemically strengthened in a molten potassium salt bath so that potassium ions replace sodium at the surface and leave a compressive layer that resists crack propagation. The value sits in the composition and the ion exchange recipe rather than in area, so price per square metre runs far above substrate glass.
Ultra-thin and flexible glass is the newest class. CNBM New Material Research Institute produces 30 micrometre flexible glass, about a third the thickness of a sheet of A4 paper, which entered mass production in 2021 and withstands more than one million folds without cracking.
At that thickness glass behaves as a formable material rather than a rigid sheet, and it competes against transparent polyimide on hardness, optical clarity and resistance to creasing while competing against itself on handling yield. The material must also be coated, cut and laminated at thickness, so the conversion chain rather than the melting furnace determines what reaches the panel maker as a good part.
Demand is set by shipped display area rather than by device units, and the two move apart. A larger average television diagonal raises glass area without raising unit count, while a thinner handset cover raises value per square metre without raising area at all.
That distinction explains why the largest producer describes a content strategy rather than a volume strategy, and why its Glass Innovations segment was reported as outperforming the television unit, notebook and smartphone markets in the third quarter of 2026, markets affected by memory pricing rather than by glass availability.
The published results of the two largest producers show a flat to declining base. Glass Innovations net sales were USD 1,506 million in the third quarter of 2026 against USD 1,560 million a year earlier, a decline of 3%, with net income down 10% to USD 328 million.
AGC Electronics net sales fell 2.6% to 355.1 billion yen for the year ended 31 December 2025, with operating profit down 12.7% to 47.5 billion yen, and the company guided LCD glass substrate shipments slightly lower for 2026 with earnings improvement measures planned.
Currency is an unusually large component of reported revenue in this market because production is concentrated in Japan, Korea and Taiwan while sales are priced in dollars and yen. The largest producer hedged 94% of its yen exposure at 120 yen in the third quarter of 2026, with a company-wide hedged exposure adjustment to net sales of USD 226 million in that quarter alone.
A dollar revenue series for this market therefore carries a currency signal alongside the volume and price signal, and the hedge rate matters as much to reported sales as shipped area does. A year in which the hedge rate moves can produce a reported decline on rising area, or the reverse, which is why area and price are modelled separately in this market rather than inferred from revenue.
Supply has been contracting at the specialty end rather than expanding. AGC decided to withdraw from the business in specialty glass for chemical strengthening, and the costs associated with that decision contributed directly to the Electronics operating profit decline for 2025.
One of three established international producers leaving cover glass material is a structural change in a market where qualification with a handset maker takes years, and it concentrates the remaining position rather than opening it. The decision also indicates that realised margin in chemically strengthened glass did not support the capital employed, which is information that the reported growth of cover glass volumes on its own does not convey.
Chinese capability has moved from substrate into the highest value classes. The 8.5-generation substrate and the 30 micrometre flexible glass come from the same institute, and Bengbu holds 17 national level innovation platforms with a glass and new materials cluster targeted at 100 billion yuan, about USD 14.7 billion.
That places a state-backed producer in the ultra-thin segment at the moment foldable panels are scaling, and it changes the competitive question from whether Chinese glass can meet substrate specification to whether it can hold yield at 30 micrometres.
Entry into this market is governed by two gates that operate on different clocks. A melting tank takes years to build and is then fixed to a generation and a site, while qualification at a panel or handset maker takes a further programme cycle, so capacity decisions are made against a demand picture that will have changed by the time glass ships.
Asia-Pacific is expected to account for 86.0% of this market in 2026, the highest regional concentration in this series, because glass melting must sit within road distance of the panel fab it feeds. The Middle East & Africa is projected to grow fastest at 8.4% from the smallest base, and India is the fastest growing country at 9.4%.
Europe grows at 6.2%, holding research, cover glass finishing and automotive display positions rather than large-area substrate melting. The Middle East & Africa grows fastest at 8.4% on display assembly and automotive interior demand from the smallest base, and Latin America follows at 8.0% on automotive display assembly in Mexico and Brazil.
Growth comes from content per device rather than from shipped area. Cover glass, OLED substrate and ultra-thin flexible glass each carry a substantially higher value per square metre than large-area LCD substrate, so the mix shift raises the blended price from USD 15.33 per square metre to USD 19.28 per square metre while area grows at 3.4%.
The television unit, notebook and smartphone markets were reported as affected by memory pricing in the third quarter of 2026. When memory cost inflation raises the device bill of materials, builders trim unit plans or specification, and glass demand follows the area those units carry, so a constraint originating outside this market sets its near-term volume.
AGC decided to withdraw from that business, with the associated costs contributing to a 12.7% decline in Electronics operating profit for 2025. It removes one of three established international suppliers of cover glass material from a class where qualification takes years, concentrating the position among producers that remain qualified rather than opening it to entrants.
Production is concentrated in Japan, Korea and Taiwan while sales are priced in dollars and yen. The largest producer hedged 94% of its yen exposure at a rate of 120 yen in the third quarter of 2026, with a company-wide hedged exposure adjustment to net sales of USD 226 million in that quarter, so a dollar series moves with the hedge rate as well as with area and price.
Corning Incorporated, AGC Inc., Nippon Electric Glass Co., Ltd., SCHOTT AG and China National Building Material Group Co., Ltd. Those five companies are profiled and hold 78.5% of this market in 2026, the highest concentration in this series.
Report infographic
Market dynamics
20 factors across 5 forcesRising glass content per device
Display area per device has risen steadily through larger average television diagonals, bezel-reduced designs that convert chassis into viewing area, and multi-display vehicle interiors, and each of those raises shipped glass area without raising device unit counts.
The largest producer describes this explicitly as a content strategy and reported that its Glass Innovations segment outperformed the television unit, notebook and smartphone markets in the third quarter of 2026, markets that memory pricing had affected.
Content growth that outruns unit growth is the central mechanism in this market, because it allows glass revenue to rise in a year when device shipments do not, and it is the reason area rather than units is the correct demand measure.
OLED substrate demand
OLED panels use substrate glass with tighter requirements than LCD on surface quality and thermal stability, because the organic stack is deposited directly and defects are not maskable by a backlight. The glass is also used as the encapsulation and carrier material in several process routes, so a single panel can consume more than one glass layer.
AGC lists TFT-LCD and OLED glass substrates together with specialty glass for displays as its Display products, and reported that Display sales rose on higher LCD glass substrate shipments even as the wider Electronics segment declined.
Substrate demand migrating from LCD to OLED raises value per square metre within the same shipped area, which is why the OLED substrate segment grows at nearly three times the LCD substrate rate without a corresponding rise in tonnage.
Chemically strengthened cover glass
Cover glass protects the display and carries the touch surface, and its value derives from the aluminosilicate composition and the ion exchange recipe rather than from area, so price per square metre runs well above substrate glass. Automotive interiors have become a second demand base, with curved and cover-glass-faced instrument clusters replacing discrete gauges.
AGC supplies cover glass for car-mounted displays within its Automotive business, which places the same material class in two separately reported end markets.
Supply at this end is tightening rather than loosening, because the same company decided to withdraw from specialty glass for chemical strengthening, so demand growth meets a narrowing rather than a widening supply base.
Ultra-thin flexible glass for foldable panels
Foldable and rollable panels need a cover layer that bends to a tight radius without creasing and still resists scratching, and ultra-thin glass is the only inorganic candidate at that thickness. CNBM New Material Research Institute produces 30 micrometre flexible glass, about a third the thickness of a sheet of A4 paper, in mass production since 2021 and rated at more than one million folds without cracking.
A million-fold rating is the specification that converts a laboratory material into a consumer one, because it exceeds the fold count a handset accumulates over a service life.
Value per square metre at that thickness is the highest in this market, and yield rather than melting capacity is the constraint, which makes the segment accessible to a producer with process capability but without a new tank.
Table of contents
11 chapters · 122 sections · 258 pages · click to expandSegmental analysis
| Segment | Largest share (2026) | Fastest growth (2026–2036) |
|---|---|---|
| By Glass Type | TFT-LCD substrate glass | Ultra-thin and flexible glass |
| By Composition | Alkali-free aluminoborosilicate | Other glass compositions |
| By Application | Televisions | Automotive displays |
| Other segments | Alkali-free aluminoborosilicate | Other glass compositions |
By Glass Type
- Specialty Glass for Displays Market Analysis by Glass Type
- TFT-LCD substrate glass is expected to account for the largest share of this market in 2026.
- Large area substrate carries the majority of shipped square metres because television and monitor panels consume far more glass per unit than handsets, and an 8.5-generation sheet is about the area of six 50-inch televisions.
- That share is held against contraction rather than growth, since one established producer has guided LCD glass substrate shipments slightly lower for 2026 with earnings improvement measures planned, having already reported Electronics net sales down 2.6% and operating profit down 12.7% for 2025.
- Price per square metre in the segment continues to erode while specification requirements on thickness variation and surface quality tighten, so the area leader absorbs cost it cannot recover.
- Cover glass holds the second position by value on a far smaller area, because the aluminosilicate composition and the ion exchange recipe carry the value rather than the square metre, and handset and automotive buyers qualify a supplier across a product programme rather than a purchase order.
- The segment grows at 7.2%, and its supply base is narrowing rather than widening, since one of the three established international producers decided to withdraw from specialty glass for chemical strengthening.
- Ultra-thin and flexible glass is projected to register the highest CAGR of 13.0% during the forecast period.
- At 30 micrometres, in mass production since 2021 and rated at more than one million folds without cracking, the material has passed the durability question and now competes on handling yield, and it carries the highest value per square metre in this market.
- OLED substrate glass is expected to follow at 9.4%, since the organic stack is deposited directly and requires tighter surface and thermal specification than LCD, and several process routes consume more than one glass layer per panel as carrier and encapsulation material.
- Substrate demand migrating from LCD to OLED therefore raises value within an unchanged shipped area, which is the mechanism by which this market grows in value faster than it grows in square metres.
- TFT-LCD substrate glass is expected to hold the largest share in 2026, carrying the majority of shipped square metres, while ultra-thin and flexible glass is projected to grow fastest at 13.0%, followed by OLED substrate glass at 9.4%.
By Composition
- Specialty Glass for Displays Market Analysis by Composition
- Alkali-free aluminoborosilicate is expected to hold the largest share of this market in 2026.
- Substrate glass must be alkali-free to prevent sodium migration into the silicon layer during repeated photolithography and annealing, so the composition is not optional for the segment that carries most of the area, and it must also hold a coefficient of thermal expansion matched to the deposited films through the full process temperature range.
- The family grows at 4.8%, tracking large-area substrate rather than the faster glass types.
- Aluminosilicate compositions follow at 7.9%, holding the whole of the chemically strengthenable class, where potassium for sodium ion exchange in a molten salt bath leaves a surface compressive layer that resists crack propagation.
- Depth of that layer and the compressive stress achieved are the specification the device maker buys, and both are set by the composition and the bath recipe together rather than by either alone.
- Other glass compositions are projected to register the highest CAGR of 9.8% during the forecast period, covering the encapsulation, carrier and ultra-thin formulations that sit outside the two established families and are specified per process route rather than per panel generation.
- Composition is the least substitutable variable in this market.
- A panel maker can change supplier within a composition family after qualification, but it cannot change family without redesigning the process, which is why composition share moves only as process routes change.
By Application
- Specialty Glass for Displays Market Analysis by Application
- Televisions are expected to account for the largest share of this market in 2026, because panel diagonal rather than unit count drives glass area and a single large panel consumes more substrate than dozens of handsets.
- The segment grows slowly at 3.4%, since unit markets are mature and the growth comes from average diagonal rather than from shipments.
- Smartphones hold the second position at 6.9%, combining a small substrate area with the highest value cover glass per device, and the segment was among those reported as affected by memory pricing in the third quarter of 2026, when the largest glass producer described itself as outperforming it rather than growing with it.
- Foldable constructions raise glass content per handset by adding an ultra-thin cover layer to the existing substrate and cover stack.
- Notebooks and monitors follow at 4.6%, with demand tied to commercial refresh cycles rather than to consumer seasons, and the notebook market was also reported as affected by memory pricing in the third quarter of 2026.
- Tablets and wearables grow faster at 8.4%, where curved and foldable constructions and small high specification cover parts raise value per square metre well above the notebook average.
- Automotive displays are projected to register the highest CAGR of 10.8% during the forecast period.
- Vehicle interiors have moved to multiple bonded displays with curved cover glass spanning cluster and centre stack, and model cycles measured in years give a qualified supplier revenue visibility that handset programmes do not.
- Other displays cover signage, industrial panels, medical imaging and aviation instrumentation, and grow at 9.4% on specification requirements that commodity substrate does not meet, including wide temperature range and sustained brightness.
- Application share in this market is set by area rather than by unit count, which is why televisions lead on a shipment base that grows slowly while smartphones, shipping in far greater numbers, hold a smaller share of square metres at a much higher value per square metre.
Other segments
- Alkali-free aluminoborosilicate is expected to hold the largest share in 2026, because substrate glass must be alkali-free to prevent sodium migration into the silicon layer.
- Other glass compositions are projected to grow fastest at 9.8%.
- Televisions are expected to hold the largest share in 2026, because panel diagonal rather than unit count drives glass area, while automotive displays are projected to grow fastest at 10.8%, followed by tablets and wearables at 8.4%.
Geographic analysis
Asia-Pacific
Largest shareAsia-Pacific is expected to account for the largest share of this market in 2026, at 86%, the highest regional concentration in this series. Glass melting for displays must sit within road distance of the panel fab it feeds, because an 8.5-generation sheet the area of six 50-inch televisions cannot be economically shipped far, so capacity has followed panel capacity to China, South Korea, Taiwan and Japan. China holds the largest national position and is moving up the value range rather than holding commodity substrate. CNBM New Material Research Institute produces both 8.5-generation TFT-LCD substrates and 30 micrometre flexible glass, and Bengbu holds 17 national level innovation platforms within a cluster targeted at 100 billion yuan, about USD 14.7 billion. Japan holds the production base of two of the three established international producers, and currency therefore passes directly into reported market value, with the largest producer hedging 94% of its yen exposure at 120 yen in the third quarter of 2026. South Korea and Taiwan hold substrate and cover glass capacity sited against the panel fabs of their own display industries, and India is projected to grow fastest in the region at 9.4% as display assembly capacity is established, although no melting capacity of scale is currently recorded there.
Middle East & Africa
Fastest growthThe Middle East & Africa is projected to register the highest CAGR of 8.4% during the forecast period, from the smallest base of any region, driven by display assembly and automotive interior demand rather than by any glass melting position.
Latin America
Latin America follows at 8.0%, also from a very small base, with demand concentrated in automotive display assembly in Mexico and Brazil rather than in panel manufacture, and served by imported finished glass rather than by regional melting.
North America
North America and Europe together hold 11% of this market, carrying research, cover glass finishing and automotive display positions rather than large-area substrate melting, and growing at 6.4% and 6.2% respectively on content value rather than on area. Both regions hold headquarters and development capability well out of proportion to the glass area melted in them, which is the normal pattern where the product cannot travel but the specification can.
Competitive landscape
This market is highly concentrated, with the five companies profiled holding 78.5% of it in 2026, the highest concentration in this series. Entry requires a fusion or precision float tank committed to a generation size and a site for its campaign life, together with a qualification cycle measured in years at the panel maker, so share moves slowly and by capacity decision rather than by price.
Corning Incorporated holds the largest position and combined its Display Technologies and Specialty Materials segments into a single Glass Innovations segment effective from the first quarter of 2026. That segment recorded net sales of USD 1,506 million and net income of USD 328 million in the third quarter of 2026, and was described as outperforming the television unit, notebook and smartphone markets through a content strategy.
AGC Inc. reported Electronics net sales of 355.1 billion yen for the year ended 31 December 2025, down 2.6%, with operating profit down 12.7% to 47.5 billion yen, supplies TFT-LCD and OLED glass substrates together with specialty glass for displays, and decided to withdraw from the business in specialty glass for chemical strengthening.
Nippon Electric Glass Co., Ltd. and SCHOTT AG hold established substrate and specialty display glass positions from Japanese and German melting bases, while China National Building Material Group Co., Ltd. holds the Chinese position through CNBM New Material Research Institute, which produces 8.5-generation substrates and 30 micrometre flexible glass in mass production since 2021.
Competitive activity over the last two years has run in opposite directions at the two ends of the market. One established producer reorganised display and specialty glass into a single segment and pursued content per device, a second withdrew from chemically strengthened specialty glass altogether, and a state-backed Chinese producer entered at 30 micrometres while also holding 8.5-generation substrate capability.
Some of the key players operating in the specialty glass for displays market are Corning Incorporated, AGC Inc., Nippon Electric Glass Co., Ltd., SCHOTT AG, and China National Building Material Group Co., Ltd., among others.
- —
Corning combined Display Technologies and Specialty Materials into a single Glass Innovations segment effective from the first quarter of 2026, reporting third quarter net sales of USD 1,506 million on 27 October 2026; AGC reported Electronics net sales down 2.6% for 2025 on 6 February 2026 and decided to withdraw from specialty glass for chemical strengthening; and CNBM New Material Research Institute holds 30 micrometre flexible glass in mass production since 2021 alongside 8.5-generation substrate capability.
- Corning Incorporated
- AGC Inc.
- Nippon Electric Glass Co., Ltd.
- SCHOTT AG
- China National Building Material Group Co., Ltd
Expert perspectives
The stated demand driver for this market is device cover and substrate demand, and the published results of the two largest producers do not support it as a volume story. Glass Innovations net sales fell 3% year on year in the third quarter of 2026 with net income down 10%, and AGC Electronics net sales fell 2.6% in 2025 with operating profit down 12.7% and LCD glass substrate shipments guided slightly lower for 2026.
Growth comes from content per device rather than from devices. The largest producer reported outperforming the television unit, notebook and smartphone markets, which memory pricing had affected, and that gap between glass revenue and device units is the whole of the growth case.
That is why the value CAGR of 5.8% sits well above the volume CAGR of 3.4%, and why the blended price rises from USD 15.33 per square metre to USD 19.28 per square metre. The forecast rests on mix, not on throughput.
The base deserves care. Value fell 1.5% between 2024 and 2026, so the rate measured from the 2026 base flatters the trend; measured from the 2024 actual the market grows at 5.1% a year, and that is the figure to carry into a business case.
Currency is the second qualification. The largest producer hedged 94% of yen exposure at 120 yen in the third quarter of 2026 with a company-wide net sales adjustment of USD 226 million in that quarter, so a dollar series for this market moves with the hedge rate as well as with area and price.
The clearest structural signal is a withdrawal rather than an expansion. AGC decided to leave specialty glass for chemical strengthening, which concentrates the cover glass position among those remaining qualified, while a state-backed Chinese producer has entered at the opposite end with 30 micrometre flexible glass in mass production and 8.5-generation substrate capability. A market in which an incumbent exits the segment an entrant targets is repricing rather than simply growing, and the five profiled companies holding 78.5% means that repricing happens through capacity decisions rather than through competitive bidding.
Frequently asked questions
The market is valued at USD 11.42 billion in 2026, having stood at USD 10.92 billion in 2025 and USD 11.09 billion in 2024, and is projected to reach USD 20.07 billion by 2036.
Cite this report
Meticulous Research. (2026). Specialty Glass for Displays Market - Global Opportunity Analysis and Industry Forecast (2026-2036) (Report No. MRCHM - 1042744). Meticulous Market Research Pvt. Ltd. https://www.meticulousresearch.com/product/specialty-glass-for-displays-market-7427