Healthcare Price Transparency Software Market (2026-2036)
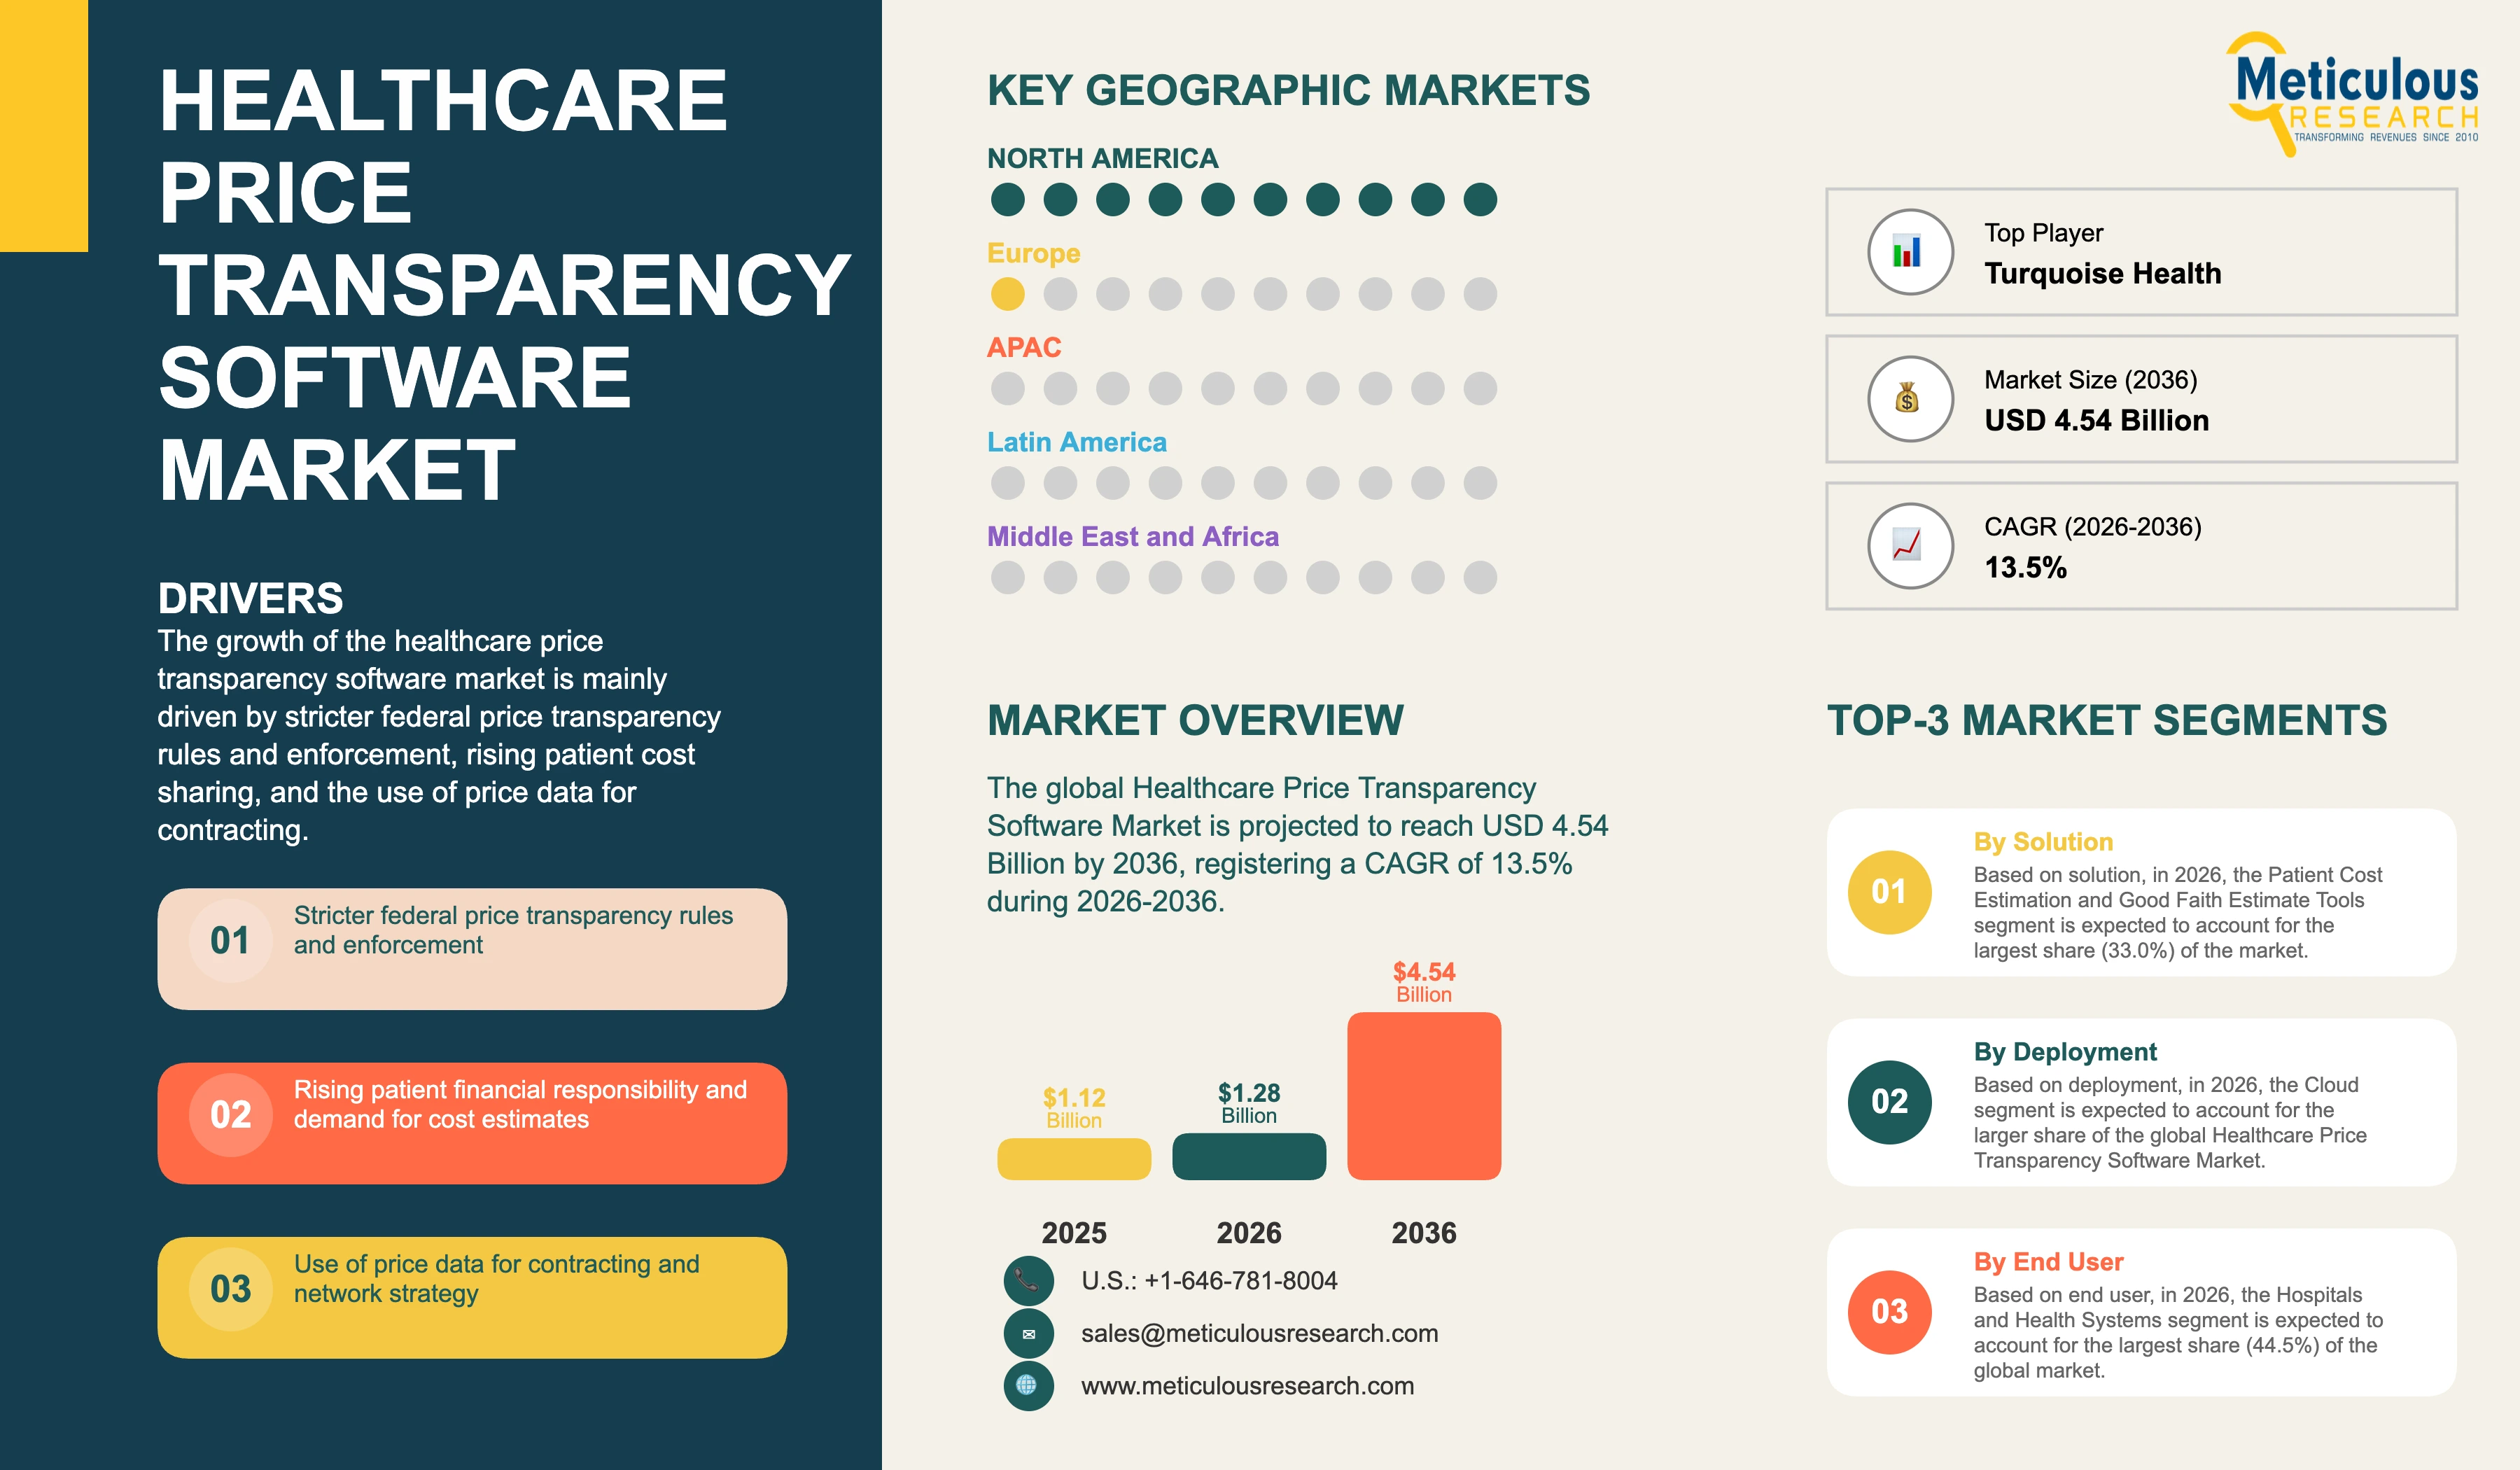
The global healthcare price transparency software market was valued at USD 1.12 billion in 2025. This market is expected to reach USD 4.54 billion by 2036 from an estimated USD 1.28 billion in 2026, registering a CAGR of 13.5% during the forecast period (2026-2036).
- Published
- Nov 2026
- Pages
- 254
- Format
- PDF + Excel
- Report ID
- MRHC - 1042582
- Base year
- 2025
- 2025 · BASELINE
- $1.12B
- 2036
- $4.54B
- CAGR 2026–2036
- 13.5%
2025 baseline · 2026–2036 forecast at 13.5% CAGR · hover a bar for the value
Key highlights
On November 21, 2025, CMS issued the CY2026 Hospital Outpatient Prospective Payment System (OPPS) final rule, which updates the hospital price transparency requirements by requiring hospitals to post the 10th percentile, median, and 90th percentile allowed amounts calculated from actual remittance data in their machine-readable files, to report the actual count of encounters behind these amounts, and to provide a more specific attestation from a senior hospital official, with enforcement of the new requirements beginning on April 1, 2026.
CMS has expanded enforcement of the hospital price transparency rule, issuing civil monetary penalties to 10 hospitals in 2025, with fines ranging from USD 32,301 to USD 309,738, and continuing to issue penalties in 2026, including a hospital fined for a second time, while HHS leadership has publicly stated that hundreds of hospitals remain out of full compliance.
CMS published version 2.0 of the Transparency in Coverage technical schema for health plan machine-readable files on October 1, 2025, with enforcement of the new schema starting on February 2, 2026, and the Departments of Labor, HHS, and the Treasury advanced further Transparency in Coverage rulemaking in 2026 to improve the usability of payer price data.
The February 2025 Executive Order on making healthcare prices clear, accurate, and actionable directed the Departments of Labor, HHS, and the Treasury to strengthen enforcement of the hospital and health plan price transparency rules and to require the posting of actual prices rather than estimates, which increases demand for compliance and data validation software.
Turquoise Health, Serif Health, Trilliant Health, and other data companies have built commercial products that collect, clean, and normalize the billions of negotiated rates published in hospital and payer machine-readable files, and they sell this data to health systems, payers, employers, brokers, and life sciences companies for contract benchmarking and market analysis.
By solution, patient cost estimation and good faith estimate tools account for the largest share of 33.0% in 2026, while price transparency data and analytics platforms register the highest CAGR.
By deployment, cloud accounts for the larger share in 2026 and also registers the higher CAGR.
By end user, hospitals and health systems account for the largest share of 44.5% in 2026, while employers, brokers, and benefits consultants register the highest CAGR.
By geography, North America accounts for the largest share of 88.0% in 2026, while Asia-Pacific registers the highest CAGR of 18.1%.
Report summary
| Particulars | Details |
|---|---|
| Base Year | 2025 |
| Estimated Year | 2026 |
| Forecast Period | 2026-2036 |
| Market Size in 2025 | USD 1.12 billion |
| Market Size in 2026 | USD 1.28 billion |
| Market Size by 2036 | USD 4.54 billion |
| CAGR (2026-2036) | 13.5% |
| Format | PDF, Excel & Cloud Portal · 254 pages |
| Largest Segment by Solution (2026) | Patient Cost Estimation and Good Faith Estimate Tools (33.0%) |
| Largest Segment by End User (2026) | Hospitals and Health Systems (44.5%) |
| Largest Region (2026) | North America (88.0%) |
| Fastest-Growing Region | Asia-Pacific (CAGR 18.1%) |
| Companies Profiled | 15 companies and other companies |
| Segments Covered | Solution, Deployment, End User, Geography |
| Countries Covered | U.S., Canada, U.K., Germany, France, Ireland, Switzerland, Netherlands, Spain, Italy, Rest of Europe, India, Australia, China, Japan, Singapore, South Korea, Rest of Asia-Pacific, Brazil, Mexico, Chile, Colombia, Rest of Latin America, U.A.E., Saudi Arabia, Israel, South Africa, Rest of Middle East & Africa |
Report overview
Segments covered: solution, deployment, end user.
The growth of this market is mainly driven by stricter federal price transparency rules for hospitals and health plans in the U.S., including the new machine-readable file requirements in the CMS CY2026 OPPS final rule and the updated Transparency in Coverage technical requirements, rising enforcement and civil monetary penalties for noncompliance, the No Surprises Act requirements for good faith estimates and advanced explanations of benefits, the growth of high-deductible health plans and patient financial responsibility, and the growing use of price transparency data by employers, health plans, and providers for contract negotiation, network design, and benefits strategy. However, factors such as the poor quality and inconsistency of published pricing data, the complexity of linking prices to real patient out-of-pocket costs, limited budgets at smaller hospitals, and regulatory uncertainty outside the U.S. are expected to restrain the growth of this market to some extent.
Healthcare price transparency software refers to the software and data solutions that help hospitals, health plans, physician groups, and other organizations publish healthcare prices in line with regulations, give patients and members accurate estimates of their costs before care, and turn published price data into insights for contracting, network design, and benefits decisions. The market includes patient cost estimation and good faith estimate tools, hospital machine-readable file compliance solutions, payer Transparency in Coverage compliance and member cost tools, price transparency data and analytics platforms, and consumer healthcare shopping platforms, delivered through cloud and on-premise deployment.
The U.S. is the center of this market, because federal regulations require hospitals and health plans to publish detailed pricing information. The Hospital Price Transparency rule, effective since January 1, 2021, requires hospitals to post a machine-readable file with standard charges for all items and services, including payer-specific negotiated rates, and a consumer-friendly display or price estimator tool for at least 300 shoppable services. CMS has steadily tightened this rule, adding a standardized template and encoding requirements in the CY2024 OPPS final rule and new requirements on allowed amounts and attestation in the CY2026 OPPS final rule.
The Transparency in Coverage rule requires most group health plans and health insurers to publish machine-readable files with in-network negotiated rates and out-of-network allowed amounts, which they have done since July 2022, and to provide members with online self-service tools that show their estimated out-of-pocket costs for all covered items and services, which became fully required in January 2024. The No Surprises Act, effective since 2022, requires providers to give good faith estimates to uninsured and self-pay patients, and its advanced explanation of benefits provisions are expected to require coordinated estimates between providers and payers.
These rules have created a large compliance market for software vendors, as hospitals use software to generate, validate, and publish their machine-readable files and shoppable services displays, to maintain chargemasters and payer contract data, and to produce accurate patient estimates. Health plans use software to generate their very large machine-readable files, which can contain billions of rates, and to run member cost estimator tools that combine negotiated rates with benefit design and accumulators.
Published price data has also created a new data and analytics market, as companies collect, clean, and normalize hospital and payer files and sell the resulting datasets and benchmarking tools. Health systems use this data to compare their rates against competitors before negotiating with payers, while payers use it to evaluate provider rates and network design. Employers, brokers, and benefits consultants use price data to choose health plans, design networks, steer employees to lower-cost providers, and meet their fiduciary duties under the Consolidated Appropriations Act of 2021, which also prohibits gag clauses on price and quality information.
Patient cost estimation is a core application, as rising deductibles and coinsurance make patients more sensitive to the cost of care. Accurate estimates help patients plan for costs, allow providers to collect payments upfront, and reduce bad debt. Estimation tools connect to eligibility checks, contract management systems, and EHRs to calculate patient responsibility for specific procedures.
Outside the U.S., price transparency software is a smaller market, but it is growing in countries where private healthcare and insurance are expanding, and where governments are introducing price publication or fee schedule requirements, such as Australia's Medical Costs Finder, India's rules on the display of hospital rates, and price lists required by health regulators in the U.A.E.
The market includes revenue cycle management vendors, price transparency specialists, healthcare data and analytics companies, payer technology vendors, and consumer navigation companies. Leading companies include Turquoise Health, Experian Health, Waystar, FinThrive, Optum, Zelis, Healthcare Bluebook, Kyruus Health, Serif Health, Trilliant Health, Craneware, Panacea Healthcare Solutions, Cedar, Claritev, and Vera Whole Health.
Over the forecast period, the healthcare price transparency software market is expected to grow rapidly, as regulations become stricter and better enforced, as published data becomes more accurate and usable, and as hospitals, payers, and employers move from basic compliance to using price data for contracting, benefits design, and consumer shopping.
Hospitals and health systems are expected to account for the largest share of 44.5% of the market in 2026, while employers, brokers, and benefits consultants are projected to register the highest CAGR.
North America is expected to account for the largest share of 88.0% of the market in 2026, mainly due to U.S. federal hospital and health plan price transparency rules, the No Surprises Act, and CMS enforcement.
Asia-Pacific is projected to register the highest CAGR of 18.1% during the forecast period, driven by the growth of private hospitals and insurance and government price publication initiatives in India, Australia, and other countries.
Key recent regulations include the CMS CY2026 OPPS final rule, which requires hospitals to post allowed amounts from actual remittance data with enforcement from April 1, 2026, and version 2.0 of the Transparency in Coverage schema, enforced from February 2, 2026.
The report profiles 15 companies, including Turquoise Health, Experian Health, Waystar, FinThrive, Optum, Zelis, Healthcare Bluebook, Kyruus Health, Serif Health, Trilliant Health, Craneware, Panacea Healthcare Solutions, Cedar, Claritev, and Vera Whole Health.
In 2026, the cloud segment is expected to account for the larger share of the healthcare price transparency software market, and it is also projected to register the higher CAGR during the forecast period.
Report infographic
Market dynamics
16 factors across 5 forcesStricter federal price transparency rules and enforcement
Federal price transparency rules are the most important driver of this market. Since the Hospital Price Transparency rule took effect in 2021, CMS has added more detailed requirements in successive rules, including a standardized machine-readable file template, encoding of payer-specific charges, and, in the CY2026 OPPS final rule, the posting of allowed amounts calculated from actual remittance data and a stronger attestation by a senior hospital official. Each new requirement forces hospitals to update their data processes and software.
Enforcement is also increasing, as CMS issued civil monetary penalties to 10 hospitals in 2025, with fines of up to USD 309,738, and continues to issue warning notices and corrective action plans to hospitals that are not compliant. The February 2025 Executive Order directed agencies to strengthen enforcement and to require actual prices, which has raised the priority of price transparency compliance for hospital leaders.
For health plans, the Transparency in Coverage rule requires the monthly publication of very large machine-readable files and the provision of member cost tools. The new version 2.0 schema, enforced from February 2026, and further rulemaking increase the work required to stay compliant. As a result, many hospitals and payers are buying specialized compliance software and services rather than relying on manual processes.
The new attestation requirement also raises the personal accountability of hospital leaders for the accuracy of published data, which encourages hospitals to invest in validation and audit tools that check files before they are posted and monitor them after publication. Hospitals that operate in several states must also manage state rules alongside federal ones, which adds to the complexity of compliance.
Rising patient financial responsibility and demand for cost estimates
Patients in the U.S. are paying a growing share of their healthcare costs, due to high-deductible health plans, higher coinsurance, and more people with marketplace plans. As patients pay more out of pocket, they want to know what care will cost before they receive it, and they are more likely to compare prices or delay care if costs are unclear. Accurate estimates are also required for uninsured and self-pay patients under the No Surprises Act good faith estimate rules.
For providers, accurate estimates help collect payments at the time of service, reduce bad debt, and improve patient satisfaction. Many health systems have made patient financial experience a priority, and they are buying estimation tools that integrate with eligibility, contract management, and EHR systems to produce estimates that reflect the patient's actual benefits.
Consumer expectations are also changing, as patients who are used to clear prices in other parts of their lives expect the same when they buy healthcare. Health systems that offer easy online estimates and payment plans can attract and keep patients, especially for shoppable services such as imaging, laboratory tests, and outpatient procedures.
Use of price data for contracting and network strategy
Published hospital and payer prices have given health systems, payers, and employers access to competitor and market rate data that was previously hidden. Health systems use price transparency data to benchmark their rates against nearby competitors before contract negotiations with payers, while payers use the data to identify high-cost providers and design narrow or tiered networks.
This use of data has created strong demand for platforms that clean and normalize the very large and inconsistent files published by hospitals and payers. Companies such as Turquoise Health, Serif Health, and Trilliant Health sell analytics products that map rates to specific services, providers, and plans, and these products are becoming standard tools for managed care contracting teams.
Life sciences companies, investors, and consulting firms also use price transparency data to understand reimbursement for drugs, devices, and procedures, which adds further demand for data products.
Employer fiduciary obligations and benefits cost pressure
Employers that sponsor health plans face rising healthcare costs and new fiduciary obligations under the Consolidated Appropriations Act of 2021, which requires plan sponsors to attest that their plan contracts do not include gag clauses and encourages them to monitor the reasonableness of plan costs. Lawsuits against large employers over health plan costs have increased attention to how plans and administrators manage prices.
Employers, brokers, and benefits consultants are therefore using price transparency data and analytics to evaluate health plans, compare network rates, steer employees to high-value providers, and negotiate direct contracts. This has made employers and brokers one of the fastest-growing customer groups for price transparency software, and several benefits consulting firms have built their own analytics teams that use Transparency in Coverage data to support client renewals and plan design.
Table of contents
11 chapters · 150 sections · 254 pages · click to expandSegmental analysis
| Segment | Largest share (2026) | Fastest growth (2026–2036) |
|---|---|---|
| By Solution | Patient cost estimation and good faith estimate tools | Price transparency data and analytics platforms |
| By Deployment | — | — |
| By End User | Hospitals and health systems | Benefits consultants |
By Solution
- Healthcare Price Transparency Software Market Analysis by Solution
- The patient cost estimation and good faith estimate tools segment is expected to account for the largest share of 33.0% of the global healthcare price transparency software market.
- The large share of this segment is mainly due to the widespread adoption of patient estimation tools by hospitals, health systems, and physician groups to meet the shoppable services requirements of the Hospital Price Transparency rule and the good faith estimate requirements of the No Surprises Act, the growing importance of upfront patient collections as deductibles and coinsurance rise, and the integration of estimation tools with eligibility, contract management, and EHR systems.
- Vendors such as Experian Health, Waystar, FinThrive, Optum, and Panacea Healthcare Solutions offer estimation tools that are widely used by U.S. providers, and many of these tools are sold as part of broader patient access and revenue cycle suites, which supports their wide adoption.
- Patient estimation tools are also an important part of the patient financial experience, as health systems try to reduce billing surprises, improve satisfaction, and increase point-of-service collections.
- Many hospitals offer online estimators for shoppable services and provide personalized estimates through patient access staff before scheduled procedures.
- The expected implementation of advanced explanation of benefits requirements would further increase the need for estimation tools that can exchange data with payers.
- Physician groups and ambulatory surgical centers are also adding estimation tools to support self-pay patients and patients with high deductibles, which broadens the customer base of this segment beyond hospitals and supports steady growth in the number of users across the U.S. market.
- Vendors are improving accuracy by connecting estimators to real-time eligibility checks and to historical claims data for similar cases.
- However, the price transparency data and analytics platforms segment is projected to register the highest CAGR during the forecast period.
- The rapid growth of this segment is driven by the growing use of hospital and payer price data for contract negotiations, network design, and benefits strategy, the improving quality and usability of published data under the CY2026 OPPS final rule and the new Transparency in Coverage schema, and demand from employers, brokers, life sciences companies, and investors.
- Payer Transparency in Coverage compliance and member cost tools account for a large share of the market, supported by monthly file publication and member estimator requirements, while hospital machine-readable file compliance solutions remain essential for all U.S. hospitals, and consumer healthcare shopping platforms serve employers and their members.
By Deployment
- Healthcare Price Transparency Software Market Analysis by Deployment
- The cloud segment is expected to account for the larger share of the global healthcare price transparency software market.
- The large share of this segment is mainly due to the need to process, store, and publish very large machine-readable files, which can total many terabytes for payers, the need for frequent updates to meet changing regulatory templates and schemas, the ability of cloud vendors to update compliance logic for all customers at once, and the preference of hospitals and payers for software-as-a-service tools that do not require significant internal IT resources.
- Most price transparency vendors deliver their solutions through the cloud, and many offer managed services in which the vendor prepares and publishes files on behalf of the customer, which reduces the workload for hospital finance and IT teams.
- Cloud tools also allow vendors to monitor published files continuously and alert customers to errors before regulators or the public find them.
- Cloud deployment also supports data and analytics platforms that aggregate price data from thousands of hospitals and hundreds of payers, which would be impractical for individual organizations to collect and process on-premise.
- Consumer-facing estimators and shopping tools are also typically delivered through the cloud, since they must be accessible to patients and members online and must handle peak demand, for example during open enrollment periods for health plans.
- The cloud segment is also projected to register the higher CAGR during the forecast period, driven by the growth of data and analytics platforms, the shift of revenue cycle systems to the cloud, and the preference of smaller hospitals and physician groups for affordable subscription tools.
- The on-premise segment is mainly used by large health systems and payers that integrate price transparency functions into existing internal systems, data warehouses, and chargemaster or contract management software.
By End User
- Healthcare Price Transparency Software Market Analysis by End User
- The hospitals and health systems segment is expected to account for the largest share of 44.5% of the global healthcare price transparency software market.
- The large share of this segment is mainly due to the requirement for all U.S. hospitals to publish machine-readable files and shoppable services information, the increasing enforcement and penalties for noncompliance, the new requirements of the CY2026 OPPS final rule, and the use of patient estimation tools and good faith estimates to improve upfront collections and the patient experience.
- Hospitals and health systems also use price transparency data for managed care contracting and market analysis.
- Large health systems often use several price transparency solutions, including compliance tools for machine-readable files, patient estimators integrated with their EHR and revenue cycle systems, and analytics platforms that benchmark their rates against competitors.
- Smaller hospitals tend to use simpler compliance tools or managed services, often bundled at a lower price with chargemaster or revenue cycle software from their existing vendors.
- The attestation and remittance-based allowed amount requirements in the CY2026 rule increase the need for reliable data processes across both large and small hospitals.
- Hospitals also use price transparency data to review their own chargemaster pricing and to identify services where their prices are out of line with the local market, which can affect patient volumes for shoppable services.
- However, the employers, brokers, and benefits consultants segment is projected to register the highest CAGR during the forecast period.
- The rapid growth of this segment is driven by rising health plan costs, employer fiduciary obligations under the Consolidated Appropriations Act of 2021, the availability of payer rate data under the Transparency in Coverage rule, and growing use of analytics to evaluate plans, networks, and direct contracts.
- Health insurers and payers are another large segment, supported by the Transparency in Coverage file and member tool requirements, while physician groups and ambulatory surgical centers and life sciences and other users are also growing.
Geographic analysis
North America
Largest shareIn 2026, North America is expected to account for the largest share of 88.0% of the global healthcare price transparency software market. The large share of this region is mainly due to the federal Hospital Price Transparency and Transparency in Coverage rules in the U.S., the No Surprises Act good faith estimate requirements, stricter enforcement and civil monetary penalties by CMS, state price transparency laws, the high level of patient cost sharing, and the presence of most leading vendors, including Turquoise Health, Experian Health, Waystar, FinThrive, Optum, Zelis, Healthcare Bluebook, Kyruus Health, and Serif Health. The U.S. accounts for almost all of the regional market, while Canada has a smaller market linked to private clinics, supplemental insurance, and workers compensation and auto insurance claims.
Europe
Europe accounts for a small share of the market, as most European countries have public healthcare systems with regulated tariffs. However, demand is growing in markets with significant private healthcare and insurance, such as the U.K., Ireland, Switzerland, and Germany, where patients often pay directly or through private cover, where private hospitals and insurers use price publication and cost estimation tools, and the EU's broader consumer transparency rules encourage clear pricing for private services. France, the Netherlands, Spain, and Italy are also adopting cost estimation tools among private providers.
Asia-Pacific
Fastest growthAsia-Pacific is projected to register the highest CAGR of 18.1% during the forecast period. The rapid growth of this region is mainly driven by the expansion of private hospitals and private health insurance in India, China, and Southeast Asia, government initiatives on price publication, such as Australia's Medical Costs Finder and India's rules requiring display of hospital rates, and the growing digitalization of hospital billing. India's large private hospital sector and the growth of cashless insurance claims create demand for cost estimation and package pricing tools. Japan, South Korea, and Singapore also offer opportunities, especially among private hospitals and insurers.
Latin America
Latin America and the Middle East & Africa account for small shares of the market. In Latin America, Brazil, Mexico, Chile, and Colombia are adopting cost estimation tools among private hospitals and insurers, as private health plans and out-of-pocket spending grow in these countries.
Middle East & Africa
In the Middle East, mandatory health insurance and health regulator price lists in the U.A.E. and Saudi Arabia support demand for pricing and estimation tools, while Israel and South Africa have private insurance markets that use cost estimation.
Competitive landscape
The global healthcare price transparency software market is moderately fragmented, with the top five players estimated to account for about 40% of the market in 2025. The market includes revenue cycle management vendors, price transparency specialists, healthcare data and analytics companies, payer technology vendors, and consumer navigation companies.
Revenue cycle vendors such as Experian Health, Waystar, FinThrive, and Optum offer patient estimation, good faith estimate, and price transparency compliance tools as part of their patient access platforms, and they benefit from existing relationships with thousands of hospitals and physician groups. Panacea Healthcare Solutions and Craneware provide chargemaster, pricing, and price transparency solutions to hospitals.
Turquoise Health, a venture-backed company, is one of the most prominent price transparency specialists, offering compliance tools for hospitals and payers, a large price transparency dataset, and analytics for contracting. Serif Health and Trilliant Health also offer price transparency data and analytics, while Claritev provides payer cost management and pricing data services.
On the payer and consumer side, Zelis, through its Sapphire Digital business, Healthcare Bluebook, Kyruus Health, and Vera Whole Health (Castlight) provide member cost estimators and healthcare shopping tools to health plans and employers, helping them meet Transparency in Coverage requirements and steer members to high-value care. Cedar offers patient financial engagement tools, including estimates and payment plans. Many smaller vendors and startups also offer machine-readable file tools, specialty-specific estimators, and price data products for niche customer groups.
Companies compete on data coverage and quality, estimation accuracy, compliance with current regulatory requirements, integration with revenue cycle and EHR systems, analytics capabilities, and price. Key strategies include product launches for new regulatory requirements, partnerships with health systems, payers, and brokers, acquisitions of data and analytics companies, and expansion of data products for new customer groups.
We expect consolidation in this market, as revenue cycle and payer technology vendors acquire price transparency specialists to strengthen their data and analytics capabilities, and as specialists expand their product portfolios. Partnerships between data companies and benefits consultants, health plans, and revenue cycle vendors are also becoming common, as each group seeks access to cleaned price data.
Some of the key players operating in the healthcare price transparency software market are Turquoise Health, Experian Health, Waystar Holding Corp., FinThrive, Optum (UnitedHealth Group), Zelis Healthcare (Sapphire Digital), Healthcare Bluebook, Kyruus Health, Serif Health, Trilliant Health, Craneware plc, Panacea Healthcare Solutions, Cedar Cares, Inc., Claritev Corporation, and Vera Whole Health (Castlight), among others.
- —
CMS increased civil monetary penalties for noncompliant hospitals in 2025 and 2026, finalized new hospital file requirements in the CY2026 OPPS rule, and enforced the new payer file schema in 2026, while vendors expanded price data analytics products for health systems, payers, and employers.
- Experian Health
- Waystar
- FinThrive
- Optum
Expert perspectives
The healthcare price transparency software market is one of the fastest-growing segments of healthcare IT, driven by U.S. federal regulations that have made healthcare prices more visible than ever before. The market began as a compliance market, but it is quickly becoming a data and analytics market, as hospitals, payers, and employers learn to use published prices for business decisions.
Over the forecast period, the market is expected to grow at a CAGR of 13.5%, from USD 1.28 billion in 2026 to USD 4.54 billion in 2036. Growth will be supported by stricter rules and enforcement, rising patient cost sharing, the use of price data for contracting and network strategy, and growing demand from employers and brokers.
Patient cost estimation and good faith estimate tools remain the largest solution segment, while price transparency data and analytics platforms grow fastest. Cloud deployment dominates and grows faster. Hospitals and health systems remain the largest end user, while employers, brokers, and benefits consultants grow fastest. North America dominates the market, and Asia-Pacific is the fastest-growing region at a CAGR of 18.1%, from a small base.
The CY2026 OPPS final rule is an important step, as the requirement to post allowed amounts calculated from actual remittance data will make hospital price data more reliable and more useful. Combined with the version 2.0 Transparency in Coverage schema, this should improve the quality of data available for analytics and consumer tools, which we expect to accelerate adoption of data products.
For vendors, the key priorities are to keep up with regulatory changes, invest in data quality and normalization, integrate estimation with revenue cycle and payer systems, and develop analytics that support contracting and benefits decisions. Vendors that can serve several customer groups, such as hospitals, payers, and employers, with a common data platform are well positioned, since the same cleaned data can be used for compliance checks, contracting analytics, employer benefits analysis, and consumer tools.
We expect the advanced explanation of benefits requirements, once implemented, to be a major catalyst for estimation and interoperability tools. We also expect price transparency to become more closely linked with value-based care and quality data, as buyers seek to compare both price and outcomes. In our view, the market will increasingly reward vendors that can show measurable results, such as higher upfront collections, better contract terms, or lower employer health costs.
Outside the U.S., the market will remain small but is expected to grow as private healthcare expands and regulators introduce price publication rules, particularly in Asia-Pacific and the Middle East.
Customer perspectives
Buyers of healthcare price transparency software include hospitals and health systems, health insurers and payers, employers, brokers, benefits consultants, physician groups, ambulatory surgical centers, and life sciences companies. Their decisions depend mainly on regulatory compliance, data accuracy, integration with existing systems, analytics capabilities, and cost.
Vice President of Revenue Cycle - multi-hospital health system, U.S.
Our patients want to know what they will owe before they schedule a procedure, and the No Surprises Act requires us to give estimates to self-pay patients. Our estimation tool pulls eligibility and contract data so the estimate is close to the final bill, which has improved our upfront collections.
This comment explains why patient cost estimation and good faith estimate tools account for 33.0% of the market, why hospitals and health systems account for 44.5% of the market, and why North America accounts for 88.0% of the market.
Director of Managed Care Contracting - regional health system, U.S.
Before price transparency, we had little idea what competitors were paid, but now we use cleaned price data to benchmark our rates before every payer negotiation, and the new remittance-based data in hospital files should make this even more reliable.
This comment explains why price transparency data and analytics platforms are the fastest-growing solution segment.
Benefits Consultant - national employee benefits firm, U.S.
Employers are asking us to prove that their health plans are paying reasonable rates. We use Transparency in Coverage data to compare network rates across carriers and to find savings for our clients.
This comment explains why employers, brokers, and benefits consultants are the fastest-growing end user segment.
Frequently asked questions
The global healthcare price transparency software market was valued at USD 1.12 billion in 2025, up from USD 960 million in 2024, and is estimated at USD 1.28 billion in 2026. The market includes patient estimation, hospital and payer compliance, data and analytics, and consumer shopping solutions.
Cite this report
Meticulous Research. (2026). Healthcare Price Transparency Software Market - Global Opportunity Analysis and Industry Forecast (2026-2036) (Report No. MRHC - 1042582). Meticulous Market Research Pvt. Ltd. https://www.meticulousresearch.com/product/healthcare-price-transparency-software-market-7265