Sustainable Fuels for Aviation and Shipping: How SAF, Bio-Methanol and Waste-to-Hydrogen Compare
Aircraft and large ships cannot run on batteries over long distances. A long haul flight or an ocean crossing needs a dense liquid fuel, and for most of the past century that fuel has come from oil. Three cleaner options are now moving from pilot scale to real volumes: sustainable aviation fuel (SAF), bio-methanol and hydrogen made from waste.
Each one has a different buyer, a different rule book and a different cost problem. Yet all three face the same pressure. Governments have turned climate pledges into binding blending and emission rules, and fuel producers are racing to build plants fast enough to meet them.
This article puts the three side by side using the latest market data from Meticulous Research. It shows where demand is already real, where supply is still short and where growth is most likely to come from through 2036.
Key takeaways
- Regulation, not voluntary pledges, now sets demand for SAF and bio-methanol.
- SAF is the largest of the three, with the sustainable aviation fuel market valued at USD 5.01 billion in 2026. Waste-to-hydrogen is the smallest, at USD 16.3 million, but is projected to grow the fastest, at a CAGR of 39.1%.
- Cost gaps remain wide. SAF reference prices are close to three times the price of fossil kerosene, and bio-methanol from China was offered at about USD 820 per tonne in 2025 against USD 340 to 400 for conventional methanol.
- Access to feedstock and long term offtake agreements will decide which producers capture demand.
Why aviation and shipping are driving demand for sustainable fuels
Both sectors are hard to electrify, and both now operate under rules that rise year by year. That is what turns a clean fuel from a nice to have into a purchase that buyers must make.
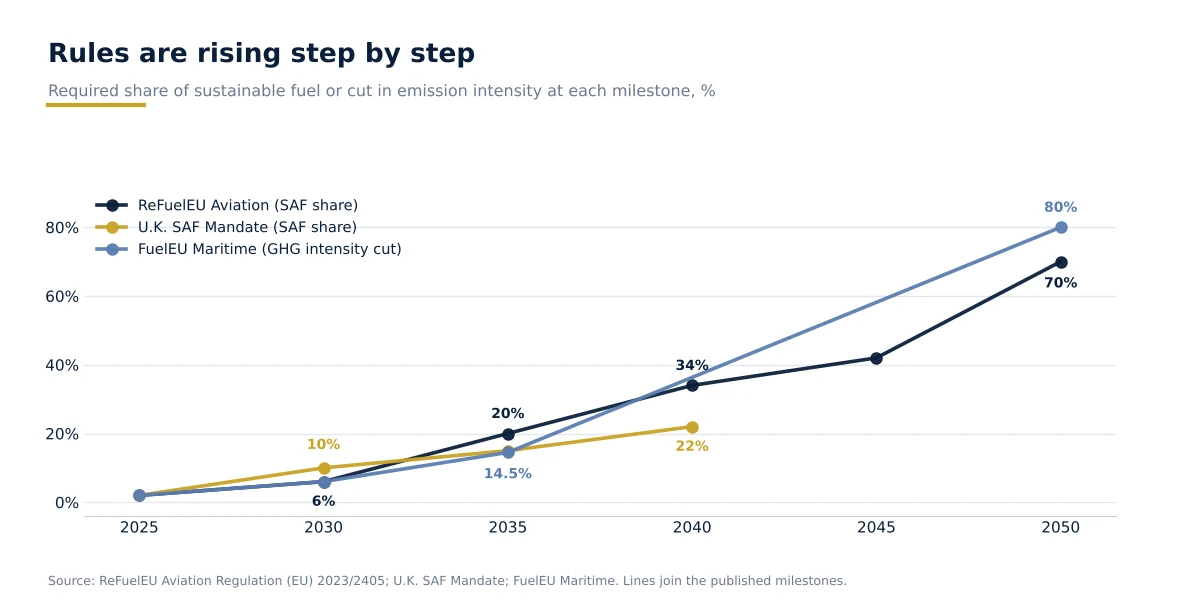
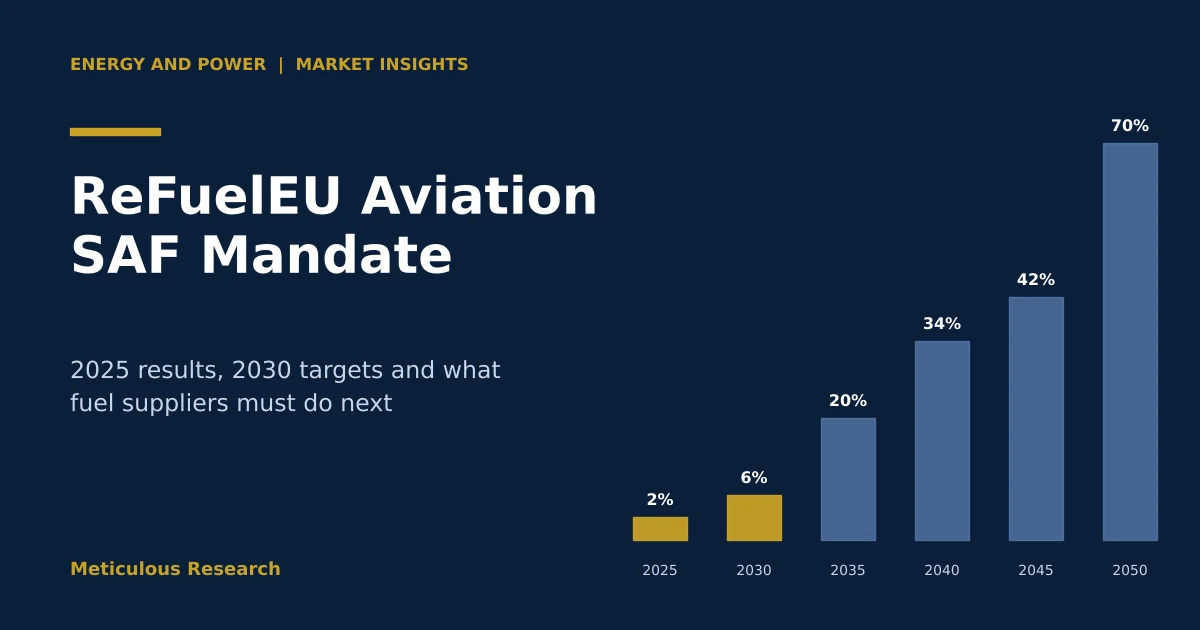
In aviation, ReFuelEU Aviation requires fuel suppliers at EU airports to deliver a minimum SAF share of 2% in 2025, rising to 6% in 2030, 20% in 2035 and 70% in 2050. The U.K. SAF Mandate follows a similar path, with 2% in 2025, 10% in 2030 and 22% in 2040.
Thus, European airlines and fuel suppliers have a fixed and rising SAF obligation to plan around, and producers can see the demand they are building for.
In shipping, FuelEU Maritime has applied since January 2025. It requires ships above 5,000 gross tonnage calling at EU ports to cut the greenhouse gas intensity of the energy they use by 2% in 2025, 6% in 2030, 14.5% in 2035 and 80% in 2050. From 2026, the EU Emissions Trading System also covers 100% of in-scope shipping emissions.
Thus, shipping lines that operate on fossil fuel face a growing cost, which makes certified low carbon fuel a commercial choice and not only a reputation one.
Sustainable aviation fuel: regulation sets the pace
Market size and supply
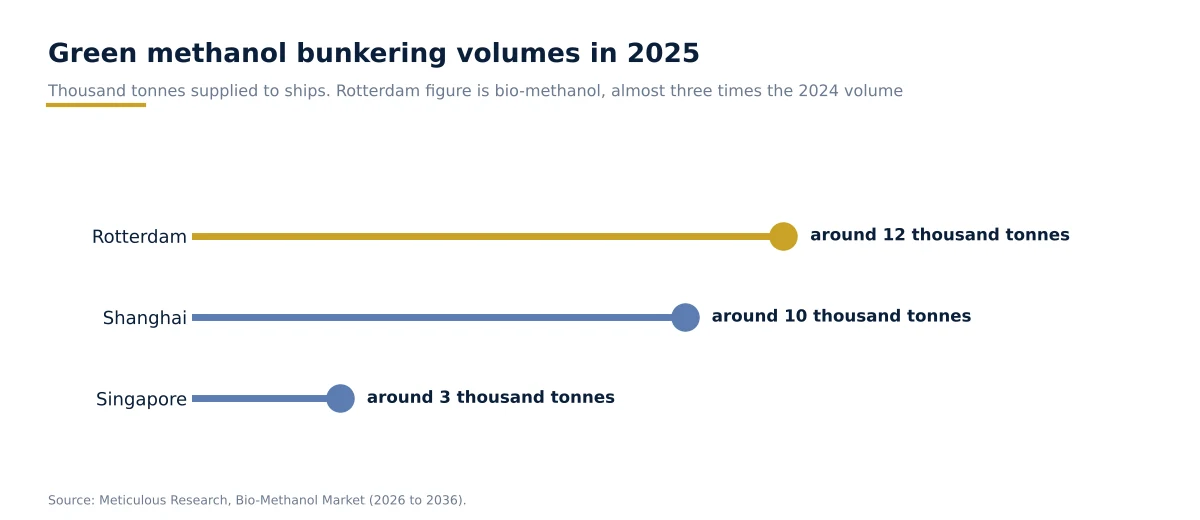
The sustainable aviation fuel market is valued at USD 5.01 billion in 2026 and is projected to reach USD 52.8 billion by 2036, at a CAGR of 26.5%. The Bio-SAF market, which covers fuel made only from biogenic feedstocks, is valued at USD 4.99 billion in 2026 and is projected to reach USD 42.0 billion by 2036, at a CAGR of 23.7%.
Supply is growing quickly but from a small base. According to the International Air Transport Association (IATA), global SAF production reached an estimated 1.9 million tonnes in 2025, up from 1.0 million tonnes in 2024. Even so, SAF made up only 0.6% of total jet fuel use.
Thus, the market is supply constrained against the mandate path, which supports double digit growth through the forecast period.
Europe met its first target comfortably. According to the European Union Aviation Safety Agency (EASA), 1.1 million tonnes of SAF were supplied at EU airports in 2025, equal to 2.8% of aviation fuel and above the 2% minimum. The step up to 6% in 2030 is much larger, so supply must roughly triple again in the second half of this decade.
Output is concentrated. Neste sold 867 thousand tonnes of SAF in 2025, more than double its 2024 volume of 412 thousand tonnes and about 46% of global volume. Thus, a small group of producers with converted refineries currently decides how much SAF reaches the market.
Feedstock is the real limit
Used cooking oil accounted for 80% of the feedstock used for SAF supplied in the EU in 2025. It is a waste feedstock, so it qualifies for stronger policy support, but the global pool of waste oils and fats is limited.
The U.K. mandate reflects this limit by capping the share of fuel that can come from hydroprocessed esters and fatty acids (HEFA). The cap falls to 71% in 2030 and 35% in 2040, which pushes investment toward other routes.
Thus, the next wave of capacity is expected to come from alcohol-to-jet and gasification based pathways. In November 2025, LanzaJet announced full operation of its Freedom Pines Fuels facility in the U.S., the first commercial scale plant to make jet fuel from ethanol. Agricultural and forestry residues are projected to be the fastest growing feedstock in the Bio-SAF market for the same reason.
The price gap and the rise of e-SAF
Prices are set largely by regulation. The European Commission set the 2025 reference price of aviation biofuels at EUR 1,925 per tonne and that of advanced aviation biofuels at EUR 3,036 per tonne, compared with EUR 640 per tonne for fossil kerosene.
Synthetic fuel, known as e-SAF, is made from renewable hydrogen and captured carbon dioxide. EASA estimates its production cost at EUR 7,520 per tonne. ReFuelEU Aviation sets minimum shares of synthetic fuel at 1.2% in 2030, 5% in 2035 and 10% in 2040, and the U.K. adds a separate power-to-liquid obligation from 2028.
Thus, e-SAF accounted for less than 0.1% of volume in 2025 but is expected to account for about 20% of market value by 2036. About 50 e-SAF projects were awaiting a final investment decision according to the ReFuelEU Aviation Annual Technical Report 2026, and the speed at which they reach financial close is the biggest variable in the forecast.
Bio-methanol: shipping is turning a chemical into a fuel
Market size and demand
The bio-methanol market is valued at USD 214.5 million in 2026 and is projected to reach USD 2.44 billion by 2036, at a CAGR of 27.5%. In volume terms, it is expected to grow from 233 kilotonnes in 2026 to 3,000 kilotonnes by 2036.
Chemical feedstock is the largest application today, as chemical makers buy bio-attributed methanol to meet product carbon footprint targets. Marine fuel is projected to grow the fastest, driven by FuelEU Maritime, the EU Emissions Trading System and the growing fleet of methanol dual-fuel vessels.
Thus, bio-methanol is shifting from a niche chemical input to a marine fuel market shaped by shipping rules.
Bunkering is scaling at major ports
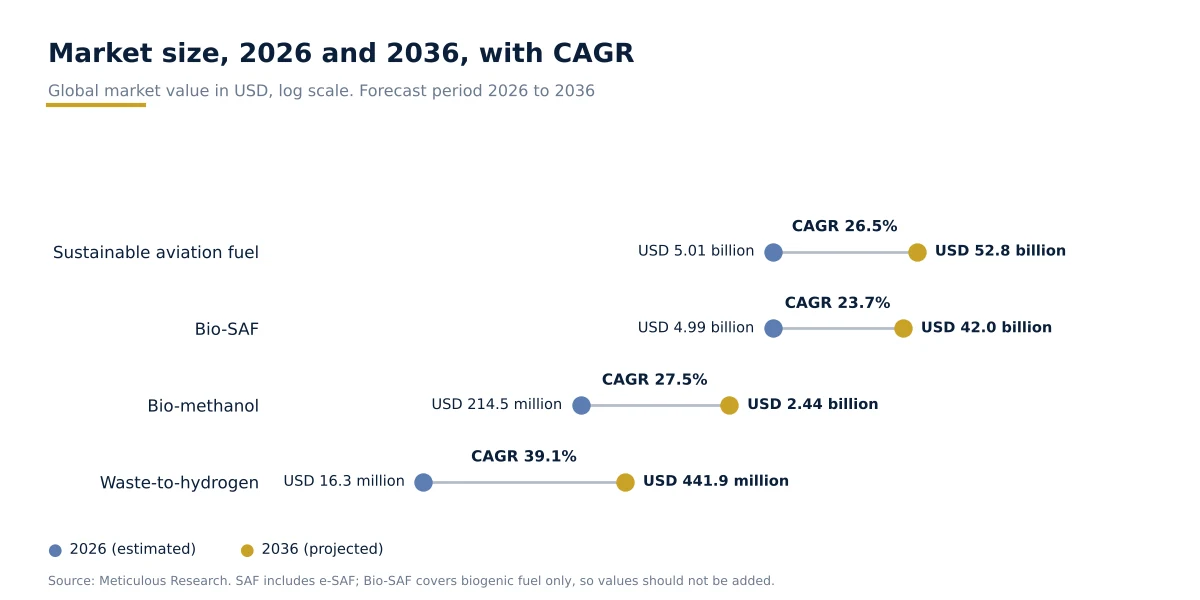
Port data shows the shift clearly. Around 12 thousand tonnes of bio-methanol were sold as bunker fuel in Rotterdam in 2025, almost three times the 2024 volume. Shanghai supplied around 10 thousand tonnes and Singapore around 3 thousand tonnes of green methanol to ships during the year.
The momentum has continued into October 2026. SinoBunker completed the first methanol bunkering operation for a RoRo vessel at Guangzhou Port on 16 October, supplying 2,300 metric tonnes of methanol, including 1,400 metric tonnes of bonded green methanol. In the same month, Rotterdam joined the Global Methanol Alliance and Singapore released a standard form for methanol bunkering.
Thus, the supply chain from plant to ship is being built port by port, and each new bunkering route makes it easier for the next shipping line to order a methanol vessel.
China leads production
According to the National Energy Administration of China, six green methanol projects with a combined capacity of about 380 thousand tonnes per year had been built in China by the end of 2025. IEA Bioenergy Task 33 identified 173 green methanol projects in the country in 2026.
New plants are arriving fast. CIMC Enric started a 50 thousand tonnes per year biomass methanol plant in Zhanjiang in December 2025, a 100 thousand tonnes per year food waste biogas methanol plant began commercial operation in Shanghai Jinshan in the same month, and Goldwind produced the first batch from its 250 thousand tonnes per year Xing'an League project in September 2026.
Thus, Asia-Pacific is expected to account for more than 60% of global demand in 2026 and to register the fastest growth through 2036.
Cost remains the main hurdle
Bio-methanol from China was offered at about USD 820 per tonne in 2025, compared with USD 340 to 400 per tonne for conventional methanol in China. According to IEA Bioenergy Task 33, production costs of green methanol in China range from RMB 3,500 to 8,000 per tonne depending on the route, and biogas reforming is the lowest cost route at RMB 3,500 to 4,000 per tonne.
Thus, buyers are paying a premium for certified low carbon methanol, and producers with cheap biogas, secured residue supply or plants close to a bunkering port are best placed to hold their margins.
Waste-to-hydrogen: the smallest market and the fastest growing
What it is and why it is growing
Waste-to-hydrogen converts household waste, industrial scrap, plastics and agricultural residues into hydrogen using heat, chemical reactions or biological processes. The syngas produced is cleaned and purified to give hydrogen that can be used as a fuel or as a chemical feedstock.
The waste-to-hydrogen market is valued at USD 16.3 million in 2026 and is projected to reach USD 441.9 million by 2036, at a CAGR of 39.1%.
Two problems drive this growth. About 95% of global hydrogen is still made from fossil fuels, emitting roughly 900 million tonnes of carbon dioxide each year. At the same time, global municipal solid waste exceeds 2 billion tonnes a year, and rules such as the EU Landfill Directive are steadily closing the cheap disposal routes.
Thus, a waste-to-hydrogen plant can earn a gate fee for taking the waste and sell the hydrogen as well, which gives it two revenue streams from one facility.
Technology, feedstock and regions
Gasification holds the largest share of the market because it is the most mature technology and accepts a wide range of waste. Plasma gasification is projected to grow the fastest. It uses torches at temperatures of 3,000 to 10,000 degrees Celsius to produce cleaner syngas and can process the most contaminated waste streams, though at higher energy and capital cost.
Municipal solid waste is the largest feedstock, while plastic waste is projected to grow the fastest as landfill diversion rules tighten in Europe, North America and Asia-Pacific. Industrial users such as refineries and chemical plants are the largest application, and transportation is projected to grow the fastest as hydrogen refuelling networks for buses and trucks expand.
Europe is expected to hold the largest share in 2026, supported by hydrogen policy and strict waste rules, while Asia-Pacific is projected to register the highest CAGR, led by Japan and South Korea.
Projects are moving from pilot to plant
Real projects are now appearing. In July 2026, Hyundai Motor Group announced that it had completed a waste-to-hydrogen production hub in Cheongju, South Korea. Also in July 2026, a memorandum was signed to explore the first waste-to-hydrogen plant in the Gulf region, proposed in Oman at an investment of around USD 1.4 billion and powered by a 300 MW solar plant.
Thus, the technology is moving from demonstration to commercial development in several regions at once, although the market is still at an early stage.
SAF, bio-methanol and waste-to-hydrogen side by side
|
Sustainable aviation fuel |
Bio-methanol |
Waste-to-hydrogen |
|
|---|---|---|---|
|
Main user |
Airlines and cargo operators |
Shipping lines and chemical makers |
Industry, refineries, hydrogen mobility |
|
Market size in 2026 |
USD 5.01 billion |
USD 214.5 million |
USD 16.3 million |
|
Projected size by 2036 |
USD 52.8 billion |
USD 2.44 billion |
USD 441.9 million |
|
CAGR (2026 to 2036) |
26.5% |
27.5% |
39.1% |
|
Main demand driver |
ReFuelEU Aviation and the U.K. SAF Mandate |
FuelEU Maritime and EU Emissions Trading System |
Hydrogen policy and landfill restrictions |
|
Biggest constraint |
Feedstock supply and cost |
Production cost and plant ramp up |
Early commercial stage |
|
Largest region in 2026 |
Europe |
Asia-Pacific |
Europe |
The sustainable aviation fuel figures include e-SAF. The Bio-SAF market covers biogenic fuel only, so the two should not be added together.
What the three markets have in common
The three fuels serve different industries, but the same four factors decide success in each.
Policy visibility. SAF and bio-methanol demand is set by rules with dates attached. Waste-to-hydrogen depends more on hydrogen incentives and waste policy, so it has less certainty.
Feedstock access. Used cooking oil limits SAF, agricultural residues limit bio-methanol and waste supply contracts limit waste-to-hydrogen. Producers that secure feedstock early hold a lasting advantage.
Long term offtake. Airlines and shipping lines that sign multi year purchase agreements give producers the revenue certainty needed to raise finance for new plants.
The cost premium. All three cost more than the fossil fuel they replace. The premium is expected to narrow as plants scale up, but not before 2030 in most cases.
There is also a link between them. Renewable hydrogen is the building block for e-SAF and e-methanol, and hybrid bio-methanol plants already combine biomass with renewable hydrogen. Thus, lower cost low carbon hydrogen, including hydrogen made from waste, supports the growth of both aviation and shipping fuels over time.
What to watch next
- Compliance reports for 2025. Official ReFuelEU Aviation and U.K. mandate compliance reports are expected by the end of 2026.
- U.K. revenue certainty mechanism. The first SAF allocation round is due to open for applications in Q1 2027, with contracts expected from Q4 2028.
- e-SAF investment decisions. The number of projects that reach financial close will show whether synthetic fuel targets for 2030 are realistic.
- Methanol plant ramp up. Plants commissioned in 2025 and 2026 need to reach stable operation to meet shipping demand.
- Waste-to-hydrogen at commercial scale. The first large plants in Asia-Pacific, Europe and the Gulf will set the cost benchmarks for the market.
Frequently asked questions
What is sustainable aviation fuel? Sustainable aviation fuel is a drop in jet fuel made from waste oils, residues, alcohols or from renewable hydrogen and captured carbon dioxide. It can be blended with conventional jet fuel and used in existing aircraft.
How big is the SAF market? The sustainable aviation fuel market is valued at USD 5.01 billion in 2026 and is projected to reach USD 52.8 billion by 2036, at a CAGR of 26.5%.
What is the difference between bio-methanol and e-methanol? Bio-methanol is made from biogenic sources such as agricultural residues, biogas and pulp mill by-products. E-methanol is made from renewable hydrogen and captured carbon dioxide. Hybrid plants that combine both are making the line between them less clear.
Why is green methanol important for shipping? Methanol dual-fuel vessels can run on green methanol to meet FuelEU Maritime and EU Emissions Trading System requirements. Vessels ordered today are expected to operate into the 2050s, so each one adds long term demand.
Can waste be turned into hydrogen? Yes. Waste is gasified or processed into syngas, which is then purified into hydrogen. The same facility can earn a gate fee for taking the waste and revenue from selling the hydrogen.
Which region leads the market for sustainable fuels? Europe leads in SAF and waste-to-hydrogen in 2026, supported by mandates and waste policy. Asia-Pacific leads in bio-methanol, driven by plants in China, and is projected to grow the fastest in all three.
Explore the full research
Meticulous Research covers each of these markets with segment level forecasts, country analysis and company profiles.
- Sustainable Aviation Fuel Market (2026 to 2036): production technology, feedstock type, blend ratio, application and end user.
- Bio-SAF Market (2026 to 2036): production pathway, feedstock and application for biogenic SAF.
- Bio-Methanol Market (2026 to 2036): feedstock, production process and application.
- Waste-to-Hydrogen Market (2026 to 2036): technology, feedstock, application and deployment model.
To see how these markets could shape your plans, download a free sample or talk to an analyst about a custom study.
Sources referenced: European Union Aviation Safety Agency (EASA); International Air Transport Association (IATA); European Commission reference prices for aviation fuels; ReFuelEU Aviation Regulation (EU) 2023/2405; FuelEU Maritime; National Energy Administration of China; IEA Bioenergy Task 33; Manifold Times (October 2026 bunkering news); Oman Observer (July 2026); Quantum Commodity Intelligence (July 2026).
Looking for full market sizing & granular datasets?
Access our comprehensive market forecast reports:
- Sustainable Aviation Fuel (SAF) Market - Global Opportunity Analysis and Industry Forecast (2026-2036)MRAD - 1041605
- Bio-SAF Market - Global Opportunity Analysis and Industry Forecast (2026-2036)MREP - 1042319
- Bio-Methanol Market - Global Opportunity Analysis and Industry Forecast (2026-2036)MREP - 1042320
- Waste-to-Hydrogen Market - Global Opportunity Analysis And Industry Forecasts (2026-2036)MRSE - 1041936
Related Market Intelligence Briefings
Recommended reading from the same research domain
METICULOUS INSIGHT
ReFuelEU Aviation SAF Mandate: 2025 Results, 2030 Targets and What Fuel Suppliers Must Do Next
The first year of the ReFuelEU Aviation SAF mandate is complete, and Europe cleared the bar. According to the European Union Aviation Safety...