Freight Procurement, Pricing and Audit Software Market (2026-2036)
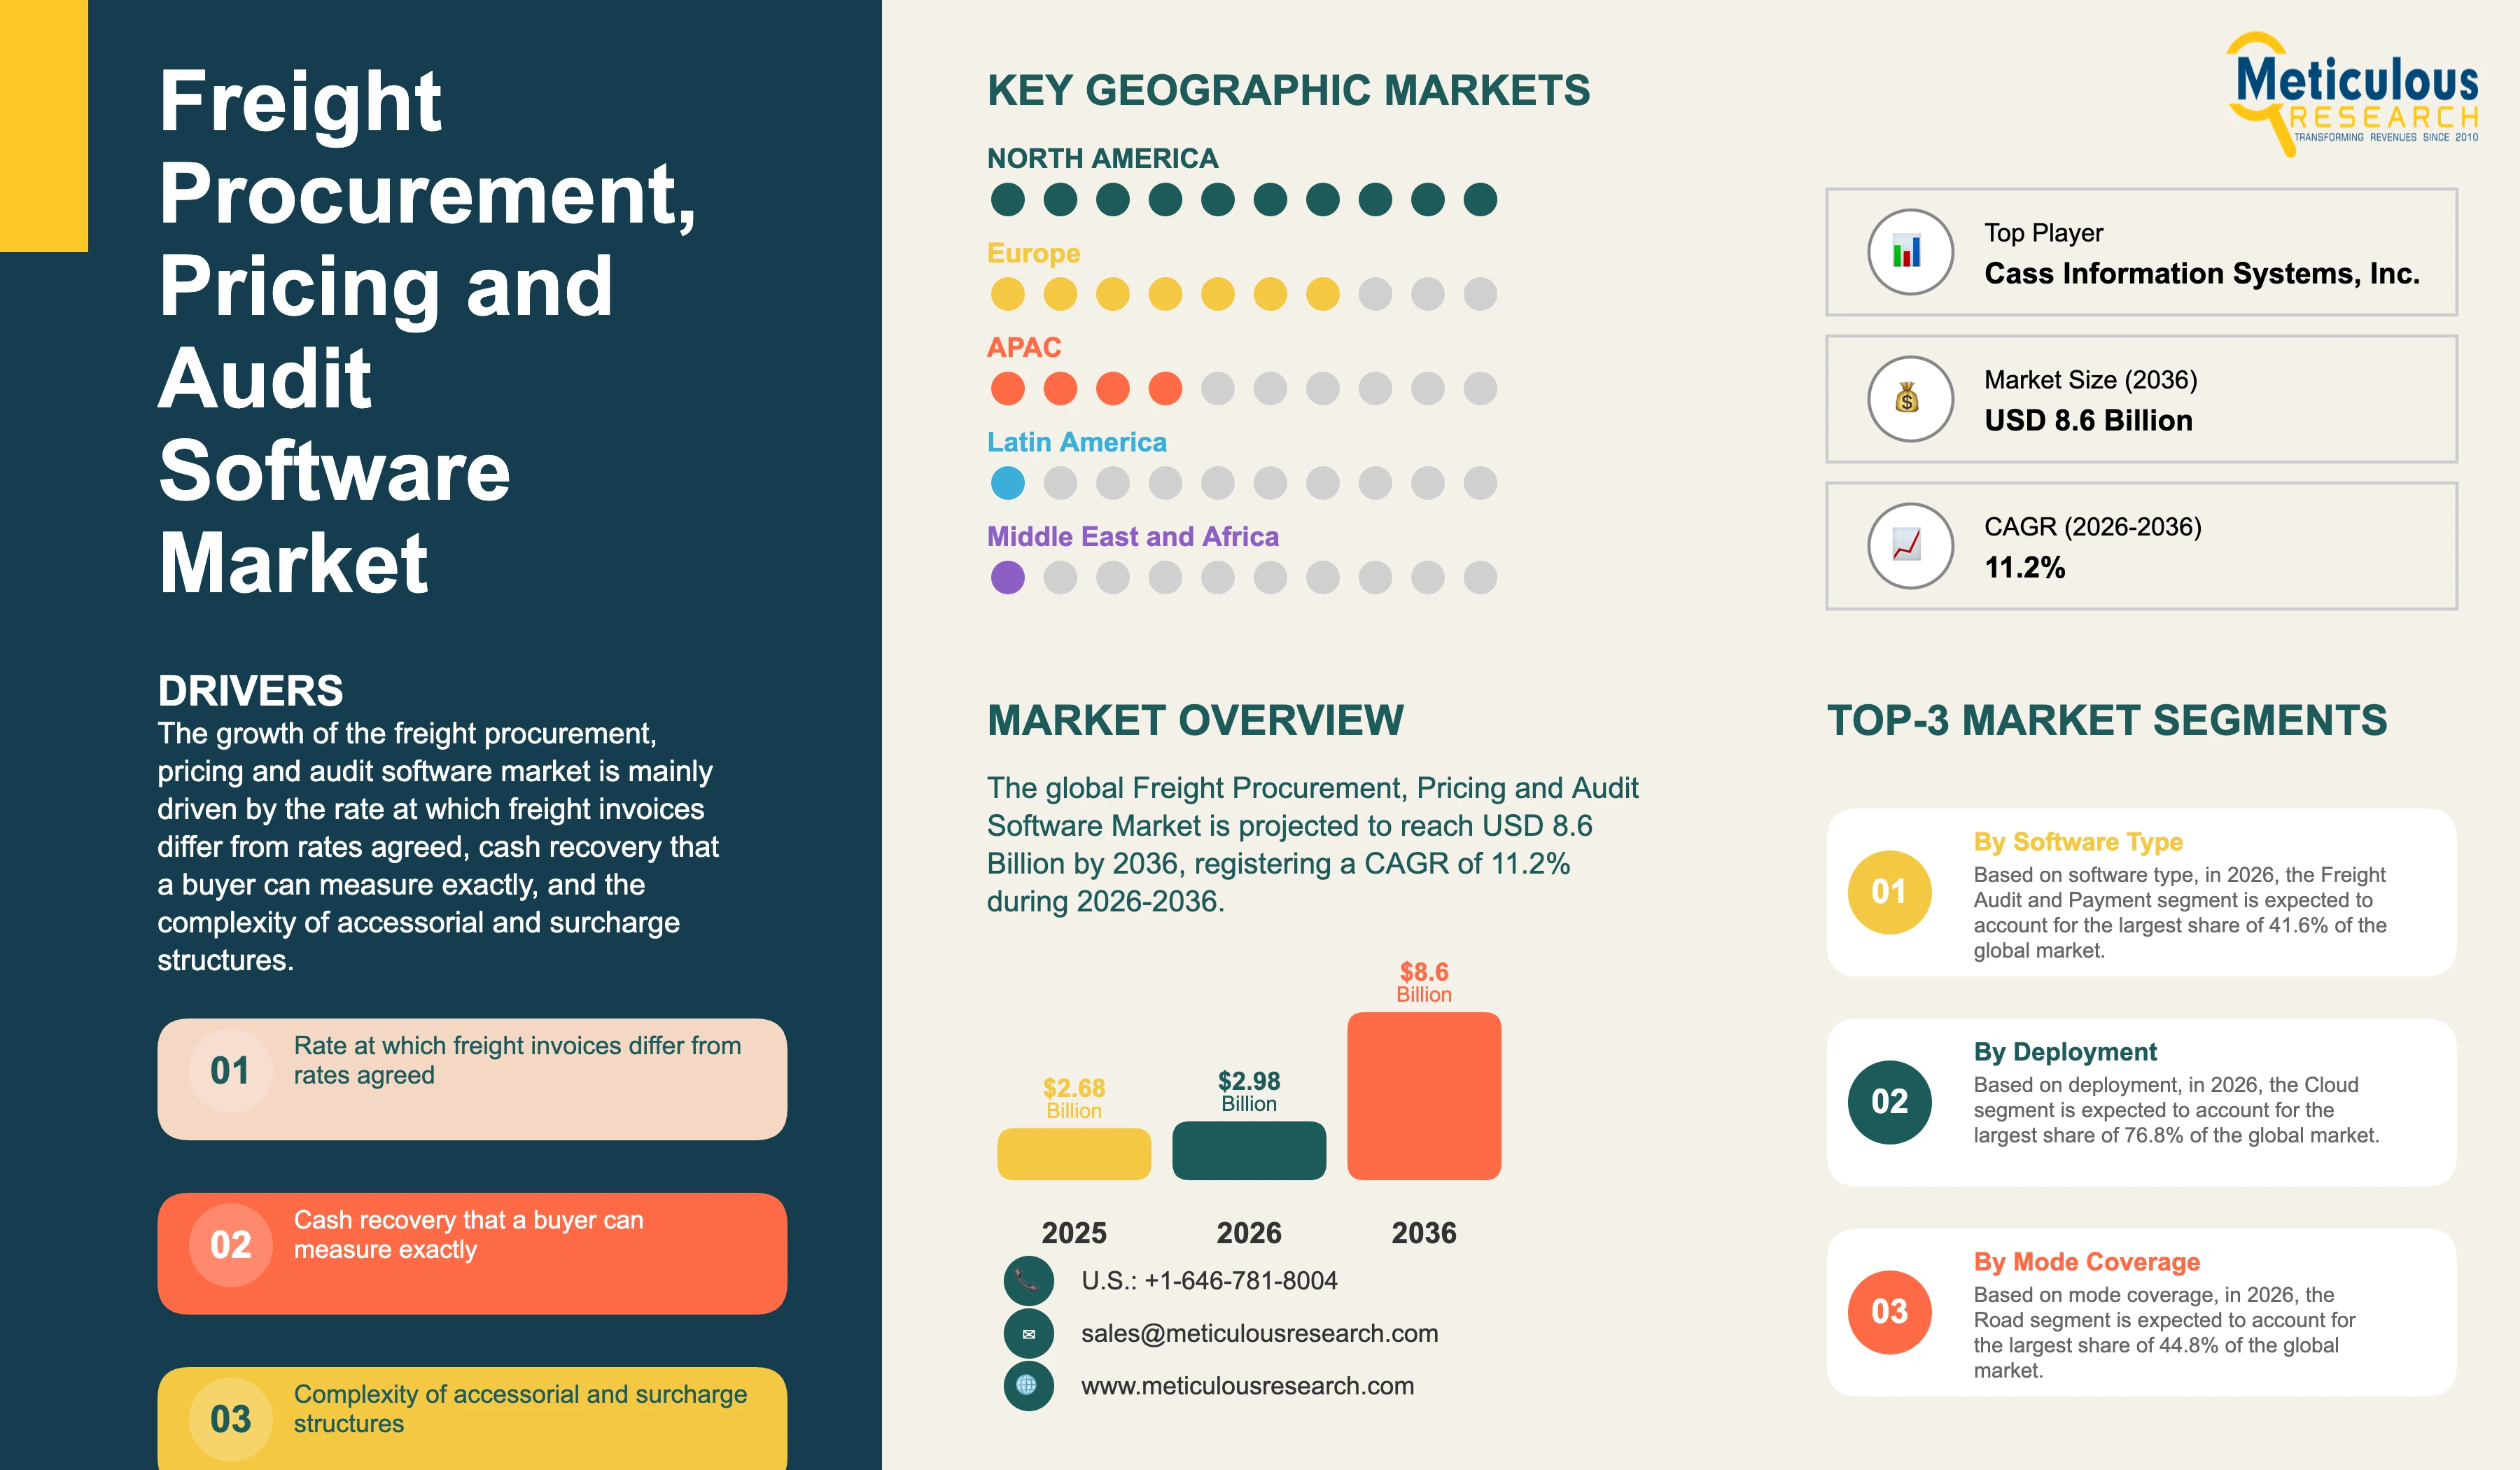
The global freight procurement, pricing and audit software market was valued at USD 2.68 billion in 2025. This market is expected to reach USD 8.60 billion by 2036 from an estimated USD 2.98 billion in 2026, registering a CAGR of 11.2% during the forecast period (2026-2036).
- Published
- Nov 2026
- Pages
- 270
- Format
- PDF + Excel
- Report ID
- MRICT - 1042552
- Base year
- 2025
- 2025 · BASELINE
- $2.68B
- 2036
- $8.60B
- CAGR 2026–2036
- 11.2%
2025 baseline · 2026–2036 forecast at 11.2% CAGR · hover a bar for the value
Key highlights
The global freight procurement, pricing and audit software market is estimated at USD 2.98 billion in 2026 and is projected to reach USD 8.60 billion by 2036.
Freight audit and payment is expected to account for the largest software type share of 41.6% in 2026, while rate management and pricing is projected to register the highest CAGR of 13.6%.
Cloud deployment is expected to hold the largest share of 76.8% in 2026, and it is also the fastest-growing deployment at a CAGR of 12.8%.
Road is expected to be the largest mode coverage with a share of 44.8% in 2026, while parcel is projected to grow fastest at a CAGR of 14.2%.
Shippers are expected to be the largest end user with a share of 48.6% in 2026, while third-party logistics providers and brokers are projected to register the highest CAGR of 13.2%.
North America is expected to hold the largest share of 46.2% in 2026, while Asia-Pacific is projected to grow fastest at a CAGR of 14.6%.
Cass Information Systems, Inc. processes and pays USD 37 billion of freight spend and 35 million freight invoices each year across a network of more than 15,000 carriers.
The audit record is the only verified account of what freight actually cost, which is why audit providers also sell freight benchmarking.
Procurement, pricing and audit are bought by sourcing, commercial and finance teams respectively, which is why no single provider leads all three.
ISO 14083:2023 provides the published methodology for quantifying transport chain emissions from the same shipment records an audit holds.
Report summary
| Particulars | Details |
|---|---|
| Base Year | 2025 |
| Estimated Year | 2026 |
| Forecast Period | 2026-2036 |
| Market Size in 2025 | USD 2.68 billion |
| Estimated Market Size in 2026 | USD 2.98 billion |
| Projected Market Size by 2036 | USD 8.60 billion |
| CAGR (2026-2036) | 11.2% |
| Format | PDF, Excel & Cloud Portal · 270 pages |
| Segments Covered | Software Type, Deployment, Mode Coverage, End User, and Geography |
| Software Types Covered | Freight Audit and Payment, Rate Management and Pricing, Freight Procurement and Sourcing, and Spend Analytics and Benchmarking |
| Deployments Covered | Cloud, and On-Premise and Private Hosted |
| Mode Coverages Covered | Road, Ocean, Air, Parcel, and Rail and Intermodal |
| End Users Covered | Shippers, Third-Party Logistics Providers and Brokers, Carriers, and Freight Forwarders |
| Geographies Covered | North America, Europe, Asia-Pacific, Latin America, and Middle East & Africa |
| Companies Profiled | 12 leading players |
Report overview
Segments covered: software type, deployment, mode coverage, end user.
The growth of this market is mainly driven by the rate at which freight invoices differ from the rates agreed, the recovery of cash that audit software produces and that a buyer can measure exactly, the complexity of accessorial and fuel surcharge structures that manual checking cannot cover, and the obligation on shippers to report freight cost and emissions from records they do not hold. However, factors such as the contested nature of savings claimed by procurement and pricing software, the separate budgets and buyers behind each of the three functions, the quality of rate and contract data that software cannot improve, and the reluctance of carriers to disclose the cost detail an audit requires are expected to restrain the growth of this market to some extent.
Freight audit and payment accounts for the largest share of this market because the recovery it produces is measurable to the penny and the function is bought by organisations that buy no other logistics software. Rate management and pricing grows faster because contract and spot rates now change frequently enough that a rate held in a spreadsheet is out of date before it is used.
Freight procurement, pricing and audit software covers three functions applied to the same freight at different points in its lifecycle. Procurement software runs the tender process by which a shipper awards lanes to carriers, pricing software holds and applies the rates that result and compares them against the market, and audit software checks the invoice that arrives after the movement against the rate that was agreed. The three are frequently described as one category and they are bought separately, by different people, against different measures of value.
The money in this market sits in the gap between the rate agreed and the invoice paid. Accessorial charges, fuel surcharges, detention and reweighs are applied after the movement by the party issuing the bill, and a shipper receiving tens of thousands of invoices has no practical means of checking them by hand. Audit software compares each invoice against the contracted rate and the shipment record and recovers the difference, and the recovery is cash returned rather than a projected saving. Cass Information Systems, Inc. processes and pays USD 37 billion of freight spend and 35 million freight invoices each year across a network of more than 15,000 carriers, which indicates the volume at which the function operates.
Audit holds the largest share of this market because its result is measurable in a way nothing else here is. A recovery appears as a credit on an account and the buyer can reconcile it to the penny, so the business case survives any level of scrutiny and the function is bought by organisations that buy no other logistics software. Procurement and pricing software produces a saving against a baseline that has to be estimated, which is the same measurement difficulty that makes managed transportation contracts contentious, and the approval it requires is correspondingly harder to obtain. The three functions therefore grow at different rates for reasons of accounting rather than capability.
The division between the three functions is reinforced by the fact that different people buy each one. Procurement software is bought by sourcing and category management teams whose performance is measured on rates awarded, pricing software by commercial and transportation teams who need a current rate to quote or to budget against, and audit software by finance and accounts payable who are accountable for what is paid. The budgets sit in different places and the evaluations run on different criteria, which is why no provider leads all three functions and why the market has not consolidated into a single suite despite every transportation management system vendor claiming the ground.
What connects the three functions commercially is the data an audit produces. The invoices an audit provider processes constitute the only verified record of what freight actually cost, as distinct from what was quoted or contracted, and that record is precisely what a procurement team needs to set a target and a pricing team needs to test a quote. Cass Information Systems, Inc. sells freight benchmarking alongside its audit, payment, accounting and invoice management services for that reason. Providers holding audit volume therefore enter pricing and procurement from an advantaged position, while providers of pricing data alone must buy or model what the audit providers observe directly.
What pricing software has to do has changed with the frequency at which rates now move. Contract rates once held for a year and were kept in a spreadsheet, and both contract and spot rates now move often enough that a stored rate is out of date before it is used, particularly in ocean freight where rates respond to capacity and routing within weeks. Shippers and forwarders need a rate that reflects current conditions at the moment of quoting, which is a continuous data problem rather than a storage problem, and it has brought rate benchmarking providers into a market previously served by transportation management modules.
These records are now used for more than cost, because the reporting obligations placed on shippers draw on the same data. ISO 14083:2023, published in March 2023 by ISO/TC 207/SC 7, establishes a common methodology for quantifying and reporting the greenhouse gas emissions of transport chain operations, and the shipment level data the calculation requires is held in the same invoice and movement records an audit process already validates. Shippers accountable for emissions they did not execute therefore find the figure most readily in their freight audit data, which has made emissions reporting a feature of audit platforms rather than a separate purchase.
North America, with a share of 46.2% in 2026 at USD 1.38 billion, with the United States growing at a CAGR of 9.6%.
Asia-Pacific, at a CAGR of 14.6%, with India at 16.8% and China at 14.2%.
Europe holds a share of 30.4% in 2026 at USD 0.91 billion and is projected to grow at a CAGR of 11.2%, with Germany at 11.4%.
The Middle East & Africa holds 2.8% at USD 0.08 billion with a CAGR of 12.0%, and Latin America holds 3.0% at USD 0.09 billion with a CAGR of 12.6%.
The 12 companies profiled accounted for 39.2% of the market in 2025, and the top five players, Cass Information Systems, Inc., Trimble Inc., SAP SE, Oracle Corporation and Trax Technologies, Inc., accounted for 22.8%.
Report infographic
Market dynamics
15 factors across 5 forcesRate at Which Freight Invoices Differ From Rates Agreed
Freight invoices are issued after the movement by the carrier, with accessorial charges, fuel surcharges, detention, reweighs and corrections applied at that point, and a proportion of them differ from the rate the shipper contracted. The difference is not usually deliberate, because rate structures are complex enough that both parties make errors, and it cannot be found without comparing each invoice against the contract and the shipment record. A shipper receiving tens of thousands of invoices has no means of doing that manually, so the discrepancy is either paid or the whole process is automated. The volume of invoices and the complexity of the charges applied to them are the conditions on which the freight procurement, pricing and audit software market depends. Shipment counts are also rising as inventory is held in smaller quantities closer to consumption, which increases the number of invoices without increasing the freight moved. Parcel adds further volume, because a single order can generate several billable movements where a pallet would once have generated one.
Cash Recovery That a Buyer Can Measure Exactly
An audit that identifies an overcharge produces a credit or a withheld payment, and the buyer reconciles it to the penny against an account rather than estimating it against a baseline. The business case therefore survives scrutiny that defeats most logistics software purchases, and it can be presented to a finance function in terms that function already uses. Providers frequently price against a proportion of what they recover, which removes the buyer risk entirely and converts the decision from an investment into a share of found money. This measurability is the reason audit is bought by organisations that have no transportation management system and no intention of buying one. It also means the purchase is approved by finance rather than by logistics, which places it outside the technology budgets that are cut first in a downturn. Contingency pricing against recovered amounts removes even the budget question, since the provider is paid from money the buyer would otherwise not have had.
Complexity of Accessorial and Surcharge Structures
A single freight invoice can carry charges for detention, layover, redelivery, liftgate, residential delivery, limited access, fuel and reweigh, each governed by terms that differ by carrier and by contract, and parcel invoices add dimensional weight and a surcharge schedule that changes annually. The number of ways a charge can be applied incorrectly rises with that complexity, and so does the proportion of invoices a shipper cannot evaluate without software. Carriers also revise surcharge schedules more often than contracts are renegotiated, which leaves a shipper paying against terms it has not reviewed. Complexity therefore drives both the need for audit and the recovery the audit produces. Each new charge type a carrier introduces widens the gap between what a shipper can check manually and what it is billed, so the driver strengthens without any change in freight volumes. Parcel invoices compound the position further, since dimensional weight is calculated rather than measured and the calculation is applied by the carrier.
Reporting Obligations Met From Freight Records
Shippers asked for transport cost and emissions reporting by customers, auditors and disclosure regimes need shipment level data that sits with whoever executed the movement rather than with the party reporting, and the freight invoice is the one document that reliably reaches the shipper for every shipment. ISO 14083:2023 establishes the methodology for quantifying transport chain emissions, and the distance, mode and weight it requires are present in the records an audit process already validates. Software that produces the emissions figure from validated freight data therefore answers an obligation the buyer cannot meet from any other source, and it does so without a separate implementation. The figure also has to withstand examination, which favours a calculation traceable to an invoice over one modelled from averages.
Table of contents
12 chapters · 132 sections · 270 pages · click to expandSegmental analysis
| Segment | Largest share (2026) | Fastest growth (2026–2036) |
|---|---|---|
| By Software Type | — | — |
| Other segments | Cloud, at a CAGR of 12.8%, which | — |
By Software Type
- Freight audit and payment, with a share of 41.6% in 2026 at USD 1.24 billion.
- Rate management and pricing, at a CAGR of 13.6%, from USD 0.79 billion and a share of 26.4% in 2026.
- Cloud, with a share of 76.8% in 2026 at USD 2.29 billion, which is also the fastest-growing deployment at a CAGR of 12.8%.
- Road, with a share of 44.8% in 2026 at USD 1.34 billion.
- Parcel, at a CAGR of 14.2%, from USD 0.33 billion and a share of 11.2% in 2026.
- Shippers, with a share of 48.6% in 2026 at USD 1.45 billion.
- Third-party logistics providers and brokers, at a CAGR of 13.2%, from USD 0.78 billion and a share of 26.2% in 2026.
Other segments
- Cloud, at a CAGR of 12.8%, which is also the largest deployment segment.
Geographic analysis
North America
Largest shareIn 2026, North America is expected to account for the largest share of 46.2% of the global freight procurement, pricing and audit software market, valued at USD 1.38 billion. The region holds this position because its carrier base is the most fragmented in the world, which multiplies both the number of invoices a shipper receives and the variation in how charges are applied, and because accessorial and surcharge structures in North American road and parcel freight are more elaborate than elsewhere. Freight audit and payment emerged as a distinct service in this region, with Cass Information Systems, Inc. processing USD 37 billion of freight spend and 35 million invoices each year, so the carrier connections and the rate libraries are deepest here. The United States is projected to grow at a CAGR of 9.6% during the forecast period, with growth moderated by the proportion of large shippers already running an audit programme and by pricing that has moved toward a share of recoveries rather than a licence, which ties provider revenue to carrier billing accuracy rather than to software demand. Canada is served from the same carrier connections and rate libraries, so it adopts without separate development. Mexican cross-border freight is managed from the same programmes, though it is reported within Latin America. Europe follows North America on invoice complexity but splits across more jurisdictions, so providers there carry tax and electronic invoicing handling that a domestic United States programme does not require, which is why the regional provider base there is more fragmented than in North America, with national providers holding positions a single platform has not displaced.
Asia-Pacific
Fastest growthHowever, Asia-Pacific is projected to register the highest CAGR of 14.6% during the forecast period. The rapid growth of this region is attributed to export freight requiring ocean and air rate management where rates move within weeks, which is the condition rate benchmarking addresses most directly, and to freight payment processes that were handled on spreadsheets inside finance teams now being contracted to providers. Cross-border movements also generate customs and documentation charges alongside freight charges, which raises the number of chargeable elements an invoice carries. Adoption is starting from a low base, so the increase reflects first programmes rather than replacement of existing ones. Providers entering the region also compete on currency, tax and documentation handling rather than against an established audit programme. India is projected to grow at a CAGR of 16.8% and China at 14.2%.
Competitive landscape
The competitive structure of the freight procurement, pricing and audit software market follows the division between its three functions rather than cutting across it. Cass Information Systems, Inc., Trax Technologies, Inc. and nVision Global Technology Solutions, Inc. lead in freight audit and payment, where carrier connections and rate libraries built over years are the barrier. Xeneta AS and Freightos Limited compete in rate management and benchmarking, where continuous data coverage rather than functionality decides the outcome. Trimble Inc., SAP SE, Oracle Corporation, WiseTech Global Limited and The Descartes Systems Group Inc. sell procurement and rating within wider transportation platforms, Loadsmart, Inc. presents its transportation management system as planning, procuring and executing freight and packages load audit as an agent rather than as an audit service, and C.H. Robinson Worldwide, Inc. offers procurement and audit as part of its managed services.
Competition turns on the depth of carrier connections and rate libraries in audit, on data coverage in benchmarking and on integration with the system of record in procurement, which is why the three provider groups have grown without displacing one another. The structural advantage sits with the audit providers, because the invoices they process are the only verified record of what freight actually cost and that record is what procurement and pricing need, which is the reason audit providers sell benchmarking while rate providers must model what audit providers observe. Separate budgets behind each function also mean a provider displaced in one usually retains the others, so consolidation has been slower than the overlap in functionality would suggest. The 12 companies profiled accounted for 39.2% of the market in 2025, and the remainder sits with regional audit providers and with transportation platforms selling procurement and rating as modules rather than as products. Acquisition is the most likely route by which the functions combine, because an audit provider can buy rate data faster than it can assemble coverage and a platform provider can buy audit volume faster than it can win it. Platform providers packaging audit as an agent rather than as a service reach the function without the carrier connections and rate libraries the specialists hold, which suits buyers already running the platform and does not yet threaten the specialist position.
Some of the key players operating in the freight procurement, pricing and audit software market are Cass Information Systems, Inc. (U.S.), Trimble Inc. (U.S.), SAP SE (Germany), Oracle Corporation (U.S.), Trax Technologies, Inc. (U.S.), WiseTech Global Limited (Australia), The Descartes Systems Group Inc. (Canada), nVision Global Technology Solutions, Inc. (U.S.), Freightos Limited (Israel), Xeneta AS (Norway), C.H. Robinson Worldwide, Inc. (U.S.), and Loadsmart, Inc. (U.S.), among others.
- —
Cass Information Systems, Inc. now processes and pays USD 37 billion of freight spend and 35 million freight invoices each year across more than 15,000 carriers and sells freight benchmarking and parcel spend management alongside audit and payment, and ISO 14083:2023 established the methodology by which audit platforms produce transport emissions reporting from validated shipment records.
- Cass Information Systems, Inc. (U.S.)
- Trimble Inc. (U.S.)
- SAP SE · Germany
- Oracle Corporation (U.S.)
- Trax Technologies, Inc. (U.S.)
- WiseTech Global Limited · Australia
- Descartes Systems Group Inc. · Canada
- nVision Global Technology Solutions, Inc. (U.S.)
- Freightos Limited · Israel
- Xeneta AS · Norway
- C.H. Robinson Worldwide, Inc. (U.S.)
- Loadsmart, Inc. (U.S.)
Expert perspectives
The value in this market sits in the gap between the rate agreed and the invoice paid, and that gap is the only part of it a buyer can measure exactly. An audit recovery appears as a credit on an account and reconciles to the penny, which is why audit holds the largest share and why it is bought by organisations that own no other logistics software. Procurement and pricing produce savings against an estimated baseline, and the dispute over whether the software or the freight market delivered the reduction is the reason those functions sell more slowly despite addressing larger sums.
Three functions sold to three buyers is the structural fact that has kept this market unconsolidated. Sourcing teams evaluate procurement, commercial teams evaluate pricing and finance evaluates audit, each with its own budget and criteria and none accountable for the combined result, so a provider selling a suite must win three evaluations rather than one. Providers consequently grow by adding customers in a single function, a provider displaced in one usually keeps the others, and every transportation management vendor claiming the whole category has so far failed to take it.
Audit data rather than software capability determines who can extend across the functions. The invoices an audit provider processes constitute the only verified account of what freight cost, as opposed to what was quoted or contracted, and that is precisely the benchmark a procurement target and a pricing decision need. Cass Information Systems, Inc. selling freight benchmarking off USD 37 billion of processed freight spend illustrates the direction, and it is a position a rate data provider can only approximate by modelling what the audit provider observes directly.
Emissions reporting will be absorbed into audit rather than bought separately, because the data it needs is already validated there. The distance, mode and weight that ISO 14083:2023 requires are already present in the records an audit validates against the contract, the figure has to survive examination and therefore favours traceability to an invoice over modelling from averages, and the provider holding the data can supply it without a new implementation. Buyers that treat emissions as a separate software purchase are solving a data problem they have already paid to solve.
Growth in the freight procurement, pricing and audit software market rests on the rate at which invoices differ from agreed rates and on the complexity of the charges applied to them, and it is paced by the quality of rate data buyers can supply and by how much cost detail carriers will disclose. Providers holding audit volume, selling benchmarking from it and reaching mid-market shippers on contingency terms will take a disproportionate share of the increase.
Customer perspectives
Finance buyers across the retail sector approve audit on a measured recovery rather than a projected saving, which is why the function reaches organisations in the industry that buy no other freight software and why the spend sits outside the technology budget.
Procurement buyers in manufacturing face a measurement dispute that audit buyers do not, and that unresolved question is what slows adoption of procurement and pricing software across the sector relative to audit, and it is why providers in the industry are moving to fixed fees rather than a share of claimed savings.
Forwarding and ocean freight buyers treat rate benchmarking as a continuously maintained data service rather than a system feature, which is why the sector purchases it separately from the platform holding its own contracted rates, and why rate benchmarking providers compete on data coverage rather than on the functionality around it, with the breadth of trades and lanes covered deciding which provider a forwarder in the sector can actually use, since a benchmark that omits a trade is of no help on it and the gaps are what forwarders in the industry test first.
“Audit was the easiest approval I have ever taken to a board, because the number is a credit on our account. Everything else in logistics software comes with an argument about the baseline.”
“We cannot tell whether our rates came down because of the platform or because the market turned. Our industry has been arguing about that baseline for years and nobody has settled it.”
“A rate we stored last month is not a rate we can quote today. Our sector needs the current market number at the moment of quoting, and that is a data subscription rather than a software module.”
Frequently asked questions
The market was valued at USD 2.68 billion in 2025 and USD 2.42 billion in 2024, and is estimated at USD 2.98 billion in 2026.
Cite this report
Meticulous Research. (2026). Freight Procurement, Pricing and Audit Software Market - Global Opportunity Analysis and Industry Forecast (2026-2036) (Report No. MRICT - 1042552). Meticulous Market Research Pvt. Ltd. https://www.meticulousresearch.com/product/freight-procurement-pricing-and-audit-software-market-7235