Resources
About Us
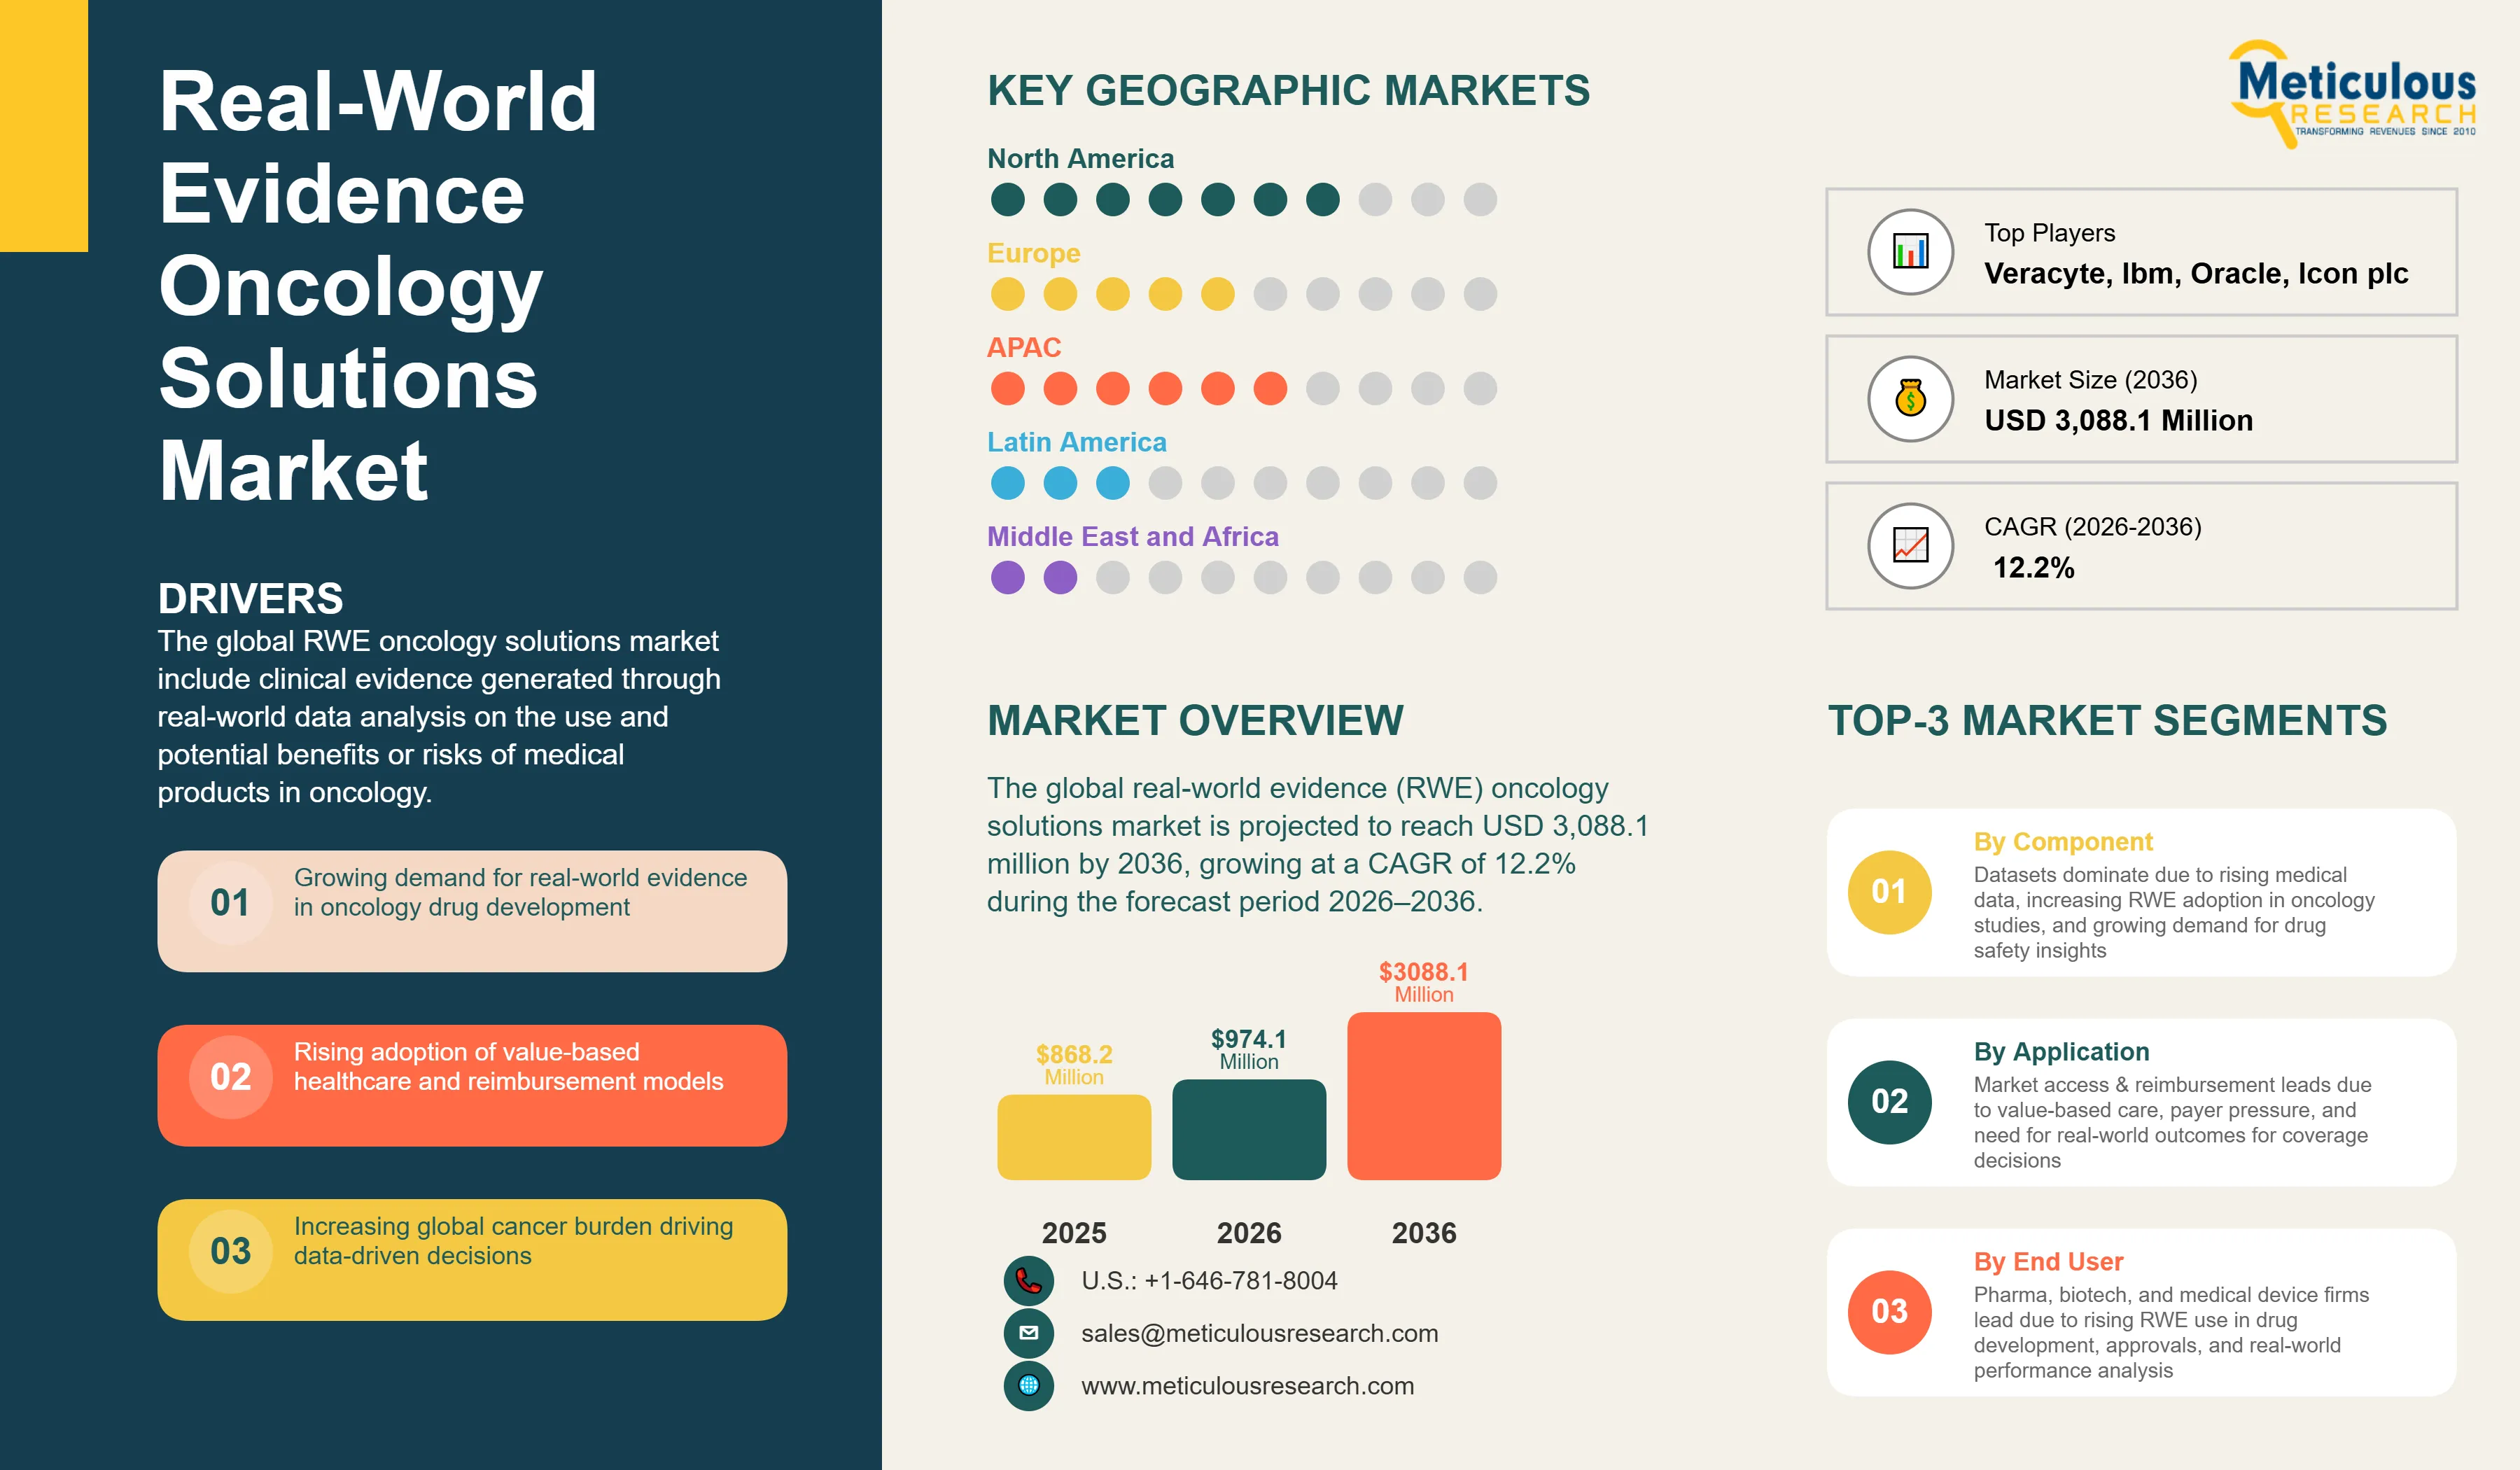
The global real-world evidence (RWE) oncology solutions market was valued at USD 974.1 million in 2026 and is projected to reach USD 3,088.1 million by 2036, growing at a CAGR of 12.2% during the forecast period 2026–2036.
Click here to: Get Free Sample Pages of this Report
The global RWE oncology solutions market include clinical evidence generated through real-world data analysis on the use and potential benefits or risks of medical products in oncology. Real-world evidence can be generated using a range of study designs, such as randomized trials, large simple trials, pragmatic trials, and both prospective and retrospective observational studies. In oncology, RWE plays a crucial role across the drug development process by helping to shorten timelines, reduce clinical trial costs, and increase the chances of technical and regulatory success.
Real-world data come from a wide range of sources that capture outcomes across diverse patient populations in everyday clinical settings. These datasets are used in secondary format, where retrospective studies are conducted to generate meaningful evidence. This evidence provides actionable insights into unmet clinical needs and the economic impact on cancer patients and healthcare systems, enables outcome determination based on much larger data samples, reduces costs, and improves the overall efficiency of clinical trials.
The growth of this market is primarily driven by the increasing demand for robust data to support oncology drug development, regulatory decision making, and value based healthcare models. Pharmaceutical companies are progressively incorporating RWE alongside randomized controlled trials to optimize clinical trial design, accelerate regulatory approvals, and support label expansions. The growing complexity and cost of oncology drug development, where therapies often require more than a decade and billions of dollars to reach approval, has further increased reliance on real-world data to allow external control arms, hybrid trials, and post marketing studies. At the same time, the shift toward value based healthcare is encouraging payers and healthcare systems to rely on real-world evidence to evaluate treatment effectiveness, long term outcomes, and economic value before granting reimbursement for high cost oncology therapies.
However, growth of this market is restrained by concerns related to data privacy and security, the lack of standardization in data collection practices, high implementation and maintenance costs, and limited interoperability between healthcare systems across different regions.
On the other hand, the expansion of RWE platforms into emerging markets, integration with precision medicine initiatives, development of AI-powered analytics solutions, and deepening partnerships between healthcare stakeholders present considerable growth opportunities for market contributors. Additionally, the ongoing shift toward patient centric healthcare models, the adoption of cloud based RWE platforms, and the real time collection and analysis of genomic and molecular data are key trends expected drive the growth of this market during the forecast period.
Driver: Growing Demand for Real-World Evidence in Drug Development
The demand for RWE in oncology drug development is accelerating as sponsors seek to optimize clinical trial design, accelerate regulatory pathways, and generate robust evidence for label expansions and post-marketing commitments. According to the Pharmaceutical Research and Manufacturers of America (PhRMA), in its January 2026 annual report, oncology accounted for nearly 40% of the global pharmaceutical pipeline, with median development timelines exceeding 10 years and costs surpassing USD 2.5 billion per approved therapy. RWE helps address these challenges by enabling external control arms, pragmatic trial designs, and hybrid decentralized studies, which can reduce patient recruitment timelines by up to 30% according to data shared by Flatiron Health in its February 2026 investor update.
Industry examples illustrate the practical application of RWE in accelerating oncology drug development. In December 2025, the FDA approved a supplemental new drug application for an immuno-oncology agent based partly on real-world data derived from Flatiron Health's oncology EHR platform, marking one of the first approvals to incorporate external control arm methodology for a metastatic indication. Similarly, IQVIA's E360 Real-world Data Platform, as referenced in the company's January 2026 corporate disclosure, now supports over 40 active oncology drug development programs globally, with dedicated modules for biomarker-stratified patient identification and real-world progression-free survival estimation.
Opportunity: Expansion In Emerging Markets
Emerging markets represent a significant growth opportunity for RWE oncology solutions, as healthcare systems in Asia-Pacific, Latin America, and the Middle East & Africa seek to build scalable evidence-generation infrastructure to support growing cancer burdens and expanding access to novel therapies. According to the International Agency for Research on Cancer (IARC), in its January 2026 GLOBOCAN update, cancer incidence in emerging economies is projected to grow at 2.1% annually through 2030, driven by population growth, aging, and lifestyle changes, creating sustained demand for RWE solutions to inform treatment decisions and policy development.
Industry examples illustrate the expanding footprint of RWE solutions in emerging markets. According to IQVIA, in its 2025 Asia-Pacific Oncology Trends report, the company's E360 platform now integrates clinical, claims, and pharmacy data from over 50 million patient lives across the region to support oncology research, with specific modules for biomarker-stratified patient identification and real-world progression-free survival estimation. Similarly, Flatiron Health, in its February 2026 public materials, reported expanded collaborations with academic cancer centers in Japan, China, and Australia to integrate de-identified oncology EHR data into its global research platform, enabling cross-border comparative effectiveness analyses.
Growing Regulatory Acceptance of RWE Accelerating Adoption Across Oncology Drug Development
Regulatory authorities in key markets are increasingly acknowledging the value of real-world evidence in healthcare decisions, offering clear guidance on how real-world data can be used in regulatory submissions and post approval studies. In December 2025, the FDA released final guidance on using real-world evidence to support medical device approvals, making it clear that patient level real-world data can be included in submissions and signaling growing regulatory acceptance of RWE for oncology applications. At the same time, DARWIN EU network of the European Medicines Agency had launched over 100 real-world data studies by mid-2025, including targeted oncological research to address regulatory questions in cancer care. These moves are helping reduce uncertainty for pharma and biotech companies using RWE in their regulatory strategies, paving the way for wider adoption across the market.
Advancements in Artificial Intelligence and Data Analytics Transforming RWE Generation
Advances in technologies like artificial intelligence, machine learning, and advanced analytics are making it easier to turn complex datasets such as electronic health records, genomic information, and claims data into actionable insights. These tools allow for more precise patient grouping, biomarker discovery, and treatment outcome prediction, increasing the usefulness of real-world evidence in oncological research and clinical care. The expanding volume of healthcare data from hospitals, along with prevalent adoption of certified health IT in acute care settings, is providing a strong foundation for AI-powered RWE platforms to generate more reliable and scalable evidence for oncology stakeholders.
Rising Global Cancer Burden Reinforcing Demand for Scalable Evidence Generation Systems
Increasing cancer incidence, driven by aging populations and lifestyle changes, is creating a strong need for scalable evidence generation systems that can analyze outcomes across diverse patient populations. Global pharmaceutical R&D spending reached approximately USD 200 to 250 billion in 2025, with oncology accounting for nearly 40% of industry pipelines, underscoring the critical role of RWE in accelerating development timelines and de risking investment decisions for sponsors. The growing complexity of oncology treatment pathways, coupled with the rapid proliferation of targeted therapies and immune oncology agents, has further intensified the need for robust real-world evidence to inform coverage and reimbursement decisions across high income and emerging markets alike.
|
Parameters |
Details |
|
Market Size by 2036 |
USD 3,088.1 Million |
|
Market Size in 2026 |
USD 974.1 Million |
|
Revenue Growth Rate (2026–2036) |
CAGR of 12.2% |
|
Dominating Component |
Datasets |
|
Dominating Application |
Market Access & Reimbursement/Coverage Decisions |
|
Dominating End User |
Pharmaceutical, Biotechnology, and Medical Device Companies |
|
Dominating Geography |
North America |
|
Fastest Growing Geography |
Asia Pacific |
|
Base Year |
2025 |
|
Forecast Period |
2026 to 2036 |
By Component: In 2026, the Datasets Segment to Dominate the Global RWE Oncology Solutions Market
Based on component, the global RWE oncology solutions market is segmented into datasets and consulting services. The large share of this segment is primarily attributed to the exponential growth of medical data generated by hospitals and health systems, the increasing dependence of outcome based oncology studies on real-world data, and the rising demand for information on drug safety among healthcare payers, providers, and regulatory bodies. The growing need for evidence generated from real-world data and the shift from volume to value based care has increased focus on cancer registries, a rise in the adoption of EHR and EMR systems in hospitals, and exponential growth in mobile health data, resulting in the generation of substantial medical data volumes suitable for oncology RWE applications.
By Application: In 2026, the Market Access and Reimbursement Segment to Hold the Largest Share
Based on application, the global RWE oncology solutions market is segmented into drug development and approvals, market access and reimbursement/coverage decisions, medical device development and approvals, post market surveillance, and other applications. The large share of this segment is primarily attributed to the increasing pressure on healthcare payers to demonstrate value for high cost oncology therapies, the growing adoption of value based contracting models, and the expanding role of health technology assessment bodies in coverage determinations. Health technology assessment agencies across high income countries increasingly request real-world data to supplement clinical trial evidence during reimbursement reviews, reinforcing reliance on RWE for market access strategies.
By End User: In 2026, the Pharmaceutical and Medical Device Companies Segment to Hold the Largest Share
Based on end user, the global RWE oncology solutions market is segmented into pharmaceutical, biotechnology, and medical device companies; healthcare payers; healthcare providers; and other end users including academic and research institutions, patient advocacy groups, regulators, and health technology assessment agencies. The large share of this segment is primarily attributed to the increasing importance of RWE studies in drug development and approvals and the growing need to avoid costly drug recalls and assess drug performance in real-world settings. Beyond regulatory approvals, pharmaceutical companies need evidence to create a more holistic picture of a drug's value and demonstrate the newly developed drug's performance outside of controlled clinical trials.
Based on geography, the global RWE oncology solutions market is segmented into North America, Europe, Asia Pacific, Latin America, and the Middle East and Africa. The dominant position of North America is primarily attributed to the rising burden of cancer, the shift towards value based care, the growth of personalized healthcare, the availability of robust electronic datasets, a well developed healthcare industry infrastructure, and rising big data adoption in the healthcare sector. Furthermore, the increase in R&D expenditure by biopharmaceutical companies, the strong presence of established RWE solution providers, and the implementation of regulatory frameworks such as the 21st Century Cures Act and the U.S. FDA's RWE Framework continue to drive market growth in this region.
Asia Pacific is expected to witness highest growth during the forecast period, driven by the rapid expansion of healthcare digitization infrastructure across China, Japan, South Korea, India, and Taiwan; the increasing cancer burden across the region; and growing government led investment in health data and precision medicine programs.
The competition within the global RWE oncology solutions market is primarily driven by data asset depth, analytical platform capabilities, regulatory expertise, and the breadth of strategic collaborations across the pharmaceutical, technology, and healthcare value chain.
IQVIA Holdings hold a leading position through its extensive real-world data assets, advanced analytics platforms, and deep domain expertise across oncology drug development and regulatory affairs. Flatiron Health maintains a strong market presence through its oncology specific electronic health record network and research grade real-world datasets supporting both clinical and regulatory applications. Tempus Labs is gaining significant ground through its AI-enabled platform that integrates molecular and clinical data for oncology research and treatment insights.
In addition, Oracle Corporation and IBM Corporation hold notable positions through their healthcare data management and analytics infrastructure, while companies such as Parexel International, ICON plc, and Syneos Health bring deep clinical research organization capabilities to RWE study design and execution.
Some of the key players operating in the global RWE oncology solutions market include IQVIA Holdings Inc. (U.S.), Flatiron Health Inc. (U.S.), Tempus Labs Inc. (U.S.), ICON plc (Ireland), Parexel International Corporation (U.S.), Syneos Health Inc. (U.S.), Oracle Corporation (U.S.), Veracyte Inc. (U.S.), SAS Institute Inc. (U.S.), IBM Corporation (U.S.), Cognizant Technology Solutions Corporation (U.S.), UnitedHealth Group Incorporated (U.S.), Anthem Inc. (U.S.), Clinigen Group plc (U.K.), and PerkinElmer Inc. (U.S.), among others.
The global RWE oncology solutions market is expected to reach USD 3,088.1 million by 2036 from an estimated USD 974.1 million in 2026, at a CAGR of 12.2% during the forecast period 2026–2036.
In 2026, the datasets segment is expected to hold the largest share of the global RWE oncology solutions market, driven by the exponential growth of medical data and the increasing dependence of outcome based studies on real-world data.
In 2026, the market access and reimbursement/coverage decisions segment is expected to account for the largest share, driven by increasing payer pressure to demonstrate value for high cost oncology therapies and the growing role of health technology assessment agencies in coverage determinations.
In 2026, the pharmaceutical, biotechnology, and medical device companies segment is expected to hold the largest share, driven by the growing importance of RWE in drug development, regulatory approvals, and post market performance assessment.
The growth of this market is primarily driven by the increasing demand for robust real-world data to support oncology drug development and regulatory decision making, the shift toward value based healthcare, rising global cancer incidence, expanding regulatory acceptance of RWE by agencies such as the FDA and EMA, and rapid advancements in AI and data analytics technologies improving the depth and reliability of real-world evidence generation.
Key players operating in the global RWE oncology solutions market include IQVIA Holdings Inc. (U.S.), Flatiron Health Inc. (U.S.), Tempus Labs Inc. (U.S.), ICON plc (Ireland), Parexel International Corporation (U.S.), Syneos Health Inc. (U.S.), Oracle Corporation (U.S.), Veracyte Inc. (U.S.), SAS Institute Inc. (U.S.), IBM Corporation (U.S.), Cognizant Technology Solutions Corporation (U.S.), UnitedHealth Group Incorporated (U.S.), Anthem Inc. (U.S.), Clinigen Group plc (U.K.), and PerkinElmer Inc. (U.S.).
Asia Pacific is expected to register the highest growth rate in the global RWE oncology solutions market during the forecast period 2026–2036, driven by expanding healthcare digitization, rising cancer burden, and growing government investment in health data infrastructure across the region.
1. Introduction
1.1. Market definition & scope
1.2. Market ecosystem
1.3. Currency & limitations
2. Research methodology
2.1. Research approach
2.2. Data collection & validation
2.2.1. Secondary research
2.2.2. Primary research
2.3. Market assessment
2.3.1. Market size estimation
2.3.2. Bottom-up approach
2.3.3. Top-down approach
2.3.4. Growth forecast
2.4. Assumptions for the study
3. Executive summary
4. Market insights
4.1. Overview
4.2. Drivers
4.2.1. Growing demand for real-world evidence in drug development
4.2.2. Increasing focus on value-based healthcare
4.2.3. Rising cancer incidence and prevalence globally
4.2.4. Regulatory support for RWE in healthcare decision-making
4.2.5. Advancements in data analytics and AI technologies
4.3. Restraints
4.3.1. Data privacy and security concerns
4.3.2. Lack of standardization in data collection
4.3.3. High implementation and maintenance costs
4.3.4. Limited interoperability between healthcare systems
4.4. Opportunities
4.4.1. Expansion in emerging markets
4.4.2. Integration with precision medicine initiatives
4.4.3. Development of AI-powered analytics solutions
4.4.4. Partnerships between healthcare stakeholders
4.5. Trends
4.5.1. Shift towards patient-centric healthcare models
4.5.2. Adoption of cloud-based RWE platforms
4.5.3. Integration of genomic and molecular data
4.5.4. Real-time data collection and analysis
4.6. Challenges
4.6.1. Regulatory compliance across different regions
4.6.2. Data quality and completeness issues
4.6.3. Integration of disparate data sources
4.7. Porter's five forces analysis
4.7.1. Bargaining power of suppliers
4.7.2. Bargaining power of buyers
4.7.3. Threat of substitutes
4.7.4. Threat of new entrants
4.7.5. Degree of competition
5. Regulatory analysis
5.1. Introduction
5.2. North america
5.3. Europe
5.4. Asia-pacific
5.5. Latin america
5.6. Middle east & africa
6. Pricing models (emr/genomic/integrated datasets)
6.1. Introduction
6.2. Pay per patient record (volume-based pricing)
6.3. Pay per usage (value-based pricing)
6.4. Annual subscription
6.5. Tiered pricing models
6.6. Custom enterprise pricing
7. Global rwe oncology solutions market, by component
7.1. Overview
7.2. Datasets
7.2.1. Disparate datasets
7.2.1.1. Emr/ehr/clinical data
7.2.1.2. Claims & billing data
7.2.1.3. Pharmacy data
7.2.1.4. Cancer registries
7.2.1.5. Other disparate datasets
7.2.2. Integrated datasets
7.3. Consulting services
8. Global rwe oncology solutions market, by application
8.1. Overview
8.2. Drug development & approvals
8.3. Market access & reimbursement/coverage decisions
8.4. Medical device development & approvals
8.5. Post-market surveillance
8.6. Other applications
9. Global rwe oncology solutions market, by end user
9.1. Overview
9.2. Pharmaceutical, biotechnology, and medical device companies
9.3. Healthcare payers
9.4. Healthcare providers
9.5. Other end users
10. Rwe oncology solutions market, by geography
10.1. Overview
10.2. North america
10.2.1. U.S.
10.2.2. Canada
10.3. Europe
10.3.1. U.K.
10.3.2. Germany
10.3.3. France
10.3.4. Italy
10.3.5. Spain
10.3.6. Rest of europe
10.4. Asia-pacific
10.4.1. Japan
10.4.2. China
10.4.3. India
10.4.4. South korea
10.4.5. Taiwan
10.4.6. Singapore
10.4.7. Australia
10.4.8. Rest of asia-pacific
10.5. Latin america
10.5.1. Brazil
10.5.2. Mexico
10.5.3. Rest of latin america
10.6. Middle east & africa
10.6.1. Uae
10.6.2. Saudi arabia
10.6.3. South africa
10.6.4. Rest of mea
11. Competitive landscape
11.1. Introduction
11.2. Competitive dashboard
11.2.1. Industry leaders
11.2.2. Market differentiators
11.2.3. Vanguards
11.2.4. Emerging companies
11.3. Market share/position analysis
12. Company profiles
12.1. Iqvia holdings inc.
12.1.1. Company overview
12.1.2. Financial overview
12.1.3. Product portfolio
12.1.4. Strategic developments
12.1.5. Swot analysis
12.2. Veracyte, inc
12.2.1. Company overview
12.2.2. Financial overview
12.2.3. Product portfolio
12.2.4. Strategic developments
12.2.5. Swot analysis
12.3. Flatiron health, inc.
12.3.1. Company overview
12.3.2. Product portfolio
12.3.3. Strategic developments
12.3.4. Swot analysis
12.4. Ibm corporation
12.4.1. Company overview
12.4.2. Financial overview
12.4.3. Product portfolio
12.4.4. Swot analysis
12.5. Oracle corporation
12.5.1. Company overview
12.5.2. Financial overview
12.5.3. Product portfolio
12.5.4. Swot analysis
12.6. Sas institute inc.
12.6.1. Company overview
12.6.2. Product portfolio
12.6.3. Swot analysis
12.7. Icon plc
12.7.1. Company overview
12.7.2. Financial overview
12.7.3. Product portfolio
12.7.4. Swot analysis
12.8. Parexel international corporation
12.8.1. Company overview
12.8.2. Product portfolio
12.8.3. Swot analysis
12.9. Syneos health, inc.
12.9.1. Company overview
12.9.2. Product portfolio
12.9.3. Swot analysis
12.10. Cognizant technology solutions corporation
12.10.1. Company overview
12.10.2. Financial overview
12.10.3. Product portfolio
12.10.4. Swot analysis
12.11. Unitedhealth group incorporated (optum)
12.11.1. Company overview
12.11.2. Financial overview
12.11.3. Product portfolio
12.11.4. Swot analysis
12.12. Anthem, inc.
12.12.1. Company overview
12.12.2. Financial overview
12.12.3. Product portfolio
12.12.4. Swot analysis
12.13. Clinigen group plc
12.13.1. Company overview
12.13.2. Product portfolio
12.13.3. Swot analysis
12.14. Perkinelmer, inc.
12.14.1. Company overview
12.14.2. Product portfolio
12.14.3. Swot analysis
12.15. Tempus labs, inc.
12.15.1. Company overview
12.15.2. Financial overview
12.15.3. Product portfolio
12.15.4. Strategic developments
12.15.5. Swot analysis
13. Appendix
13.1. Available customization
13.2. Related reports
LIST OF TABLES
Table 1. Pay-Per-Patient Record: Typical Price Ranges
Table 2. Pay-Per-Usage: Typical Price Ranges
Table 3. Annual Subscription Model: Typical Price Ranges
Table 4. Tiered Pricing Models: Typical Price Ranges
Table 5. Custom Enterprise Pricing: Typical Price Ranges
Table 6. Global Real-World Evidence Oncology Solutions Market Size, By Component, 2024–2036 (USD Million)
Table 7. Global RWD Oncology Datasets Market Size, By Country/Region, 2024–2036 (USD Million)
Table 8. Global Real-World Evidence Oncology Disparate Datasets Market Size, By Type, 2024–2036 (USD Million)
Table 9. Global RWD Oncology Disparate Datasets Market Size, By Country/Region, 2024–2036 (USD Million)
Table 10. Global RWD Oncology Emr/Ehr/Clinical Data Market Size, By Country/Region, 2024–2036 (USD Million)
Table 11. Global RWD Oncology Claims & Billing Data Market Size, By Country/Region, 2024–2036 (USD Million)
Table 12. Global RWD Oncology Pharmacy Data Market Size, By Country/Region, 2024–2036 (USD Million)
Table 13. Global RWD Oncology Cancer Registries Market Size, By Country/Region, 2024–2036 (USD Million)
Table 14. Global RWD Oncology Other Disparate Data Sets Market Size, By Country/Region, 2024–2036 (USD Million)
Table 15. Global RWD Oncology Integrated Data Sets Market Size, By Country/Region, 2024–2036 (USD Million)
Table 16. Global RWD Oncology Consulting Services Market Size, By Country/Region, 2024–2036 (USD Million)
Table 17. Global Real-World Evidence Oncology Solutions Market Size, By Application, 2024–2036 (USD Million)
Table 18. Global RWD Oncology Solution Market for Drug Development & Approvals, By Country/Region, 2024–2036 (USD Million)
Table 19. Global RWD Oncology Solution Market for Market Access & Reimbursement/Coverage Decisions, By Country/Region, 2024–2036 (USD Million)
Table 20. Global RWD Oncology Solution Market for Medical Device Development & Approvals, By Country/Region, 2024–2036 (USD Million)
Table 21. Global RWD Oncology Solution Market for Post Market Surveillance, By Country/Region, 2024–2036 (USD Million)
Table 22. Global RWD Oncology Solution Market for Other Applications, By Country/Region, 2024–2036 (USD Million)
Table 23. Global RWD Oncology Solutions Market, By End User, 2024–2036 (USD Million)
Table 24. Global RWD Oncology Solution Market for Pharmaceutical & Medical Device, By Country/Region, 2024–2036 (USD Million)
Table 25. Global RWD Oncology Solution Market for Healthcare Payers, By Country/Region, 2024–2036 (USD Million)
Table 26. Global RWD Oncology Solution Market for Healthcare Providers, By Country/Region, 2024–2036 (USD Million)
Table 27. Global RWD Oncology Solution Market for Other End Users, By Country/Region, 2024–2036 (USD Million)
Table 28. North America: RWD Oncology Solutions Market Size, By Country, 2024–2036 (USD Million)
Table 29. North America: RWD Oncology Solutions Market Size, By Component, 2024–2036 (USD Million)
Table 30. North America: RWD Oncology Datasets Market Size, By Type, 2024–2036 (USD Million)
Table 31. North America: RWD Oncology Disparate Datasets Market Size, By Type, 2024–2036 (USD Million)
Table 32. North America: RWD Oncology Solutions Market Size, By Application, 2024–2036 (USD Million)
Table 33. North America: RWD Oncology Solutions Market Size, By End User, 2024–2036 (USD Million)
Table 34. U.S.: RWD Oncology Solutions Market Size, By Component, 2024–2036 (USD Million)
Table 35. U.S.: RWD Oncology Datasets Market Size, By Type, 2024–2036 (USD Million)
Table 36. U.S.: RWD Oncology Disparate Datasets Market Size, By Type, 2024–2036 (USD Million)
Table 37. U.S.: RWD Oncology Solutions Market Size, By Application, 2024–2036 (USD Million)
Table 38. U.S.: RWD Oncology Solutions Market Size, By End User, 2024–2036 (USD Million)
Table 39. Canada: RWD Oncology Solutions Market Size, By Component, 2024–2036 (USD Million)
Table 40. Canada: RWD Oncology Datasets Market Size, By Type, 2024–2036 (USD Million)
Table 41. Canada: RWD Oncology Disparate Datasets Market Size, By Type, 2024–2036 (USD Million)
Table 42. Canada: RWD Oncology Solutions Market Size, By Application, 2024–2036 (USD Million)
Table 43. Canada: RWD Oncology Solutions Market Size, By End User, 2024–2036 (USD Million)
Table 44. Europe: RWD Oncology Solutions Market Size, By Country, 2024–2036 (USD Million)
Table 45. Europe: RWD Oncology Solutions Market Size, By Component, 2024–2036 (USD Million)
Table 46. Europe: RWD Oncology Datasets Market Size, By Type, 2024–2036 (USD Million)
Table 47. Europe: RWD Oncology Disparate Datasets Market Size, By Type, 2024–2036 (USD Million)
Table 48. Europe: RWD Oncology Solutions Market Size, By Application, 2024–2036 (USD Million)
Table 49. Europe: RWD Oncology Solutions Market Size, By End User, 2024–2036 (USD Million)
Table 50. U.K.: RWD Oncology Solutions Market Size, By Component, 2024–2036 (USD Million)
Table 51. U.K.: RWD Oncology Datasets Market Size, By Type, 2024–2036 (USD Million)
Table 52. U.K.: RWD Oncology Disparate Datasets Market Size, By Type, 2024–2036 (USD Million)
Table 53. U.K.: RWD Oncology Solutions Market Size, By Application, 2024–2036 (USD Million)
Table 54. U.K.: RWD Oncology Solutions Market Size, By End User, 2024–2036 (USD Million)
Table 55. Germany: RWD Oncology Solutions Market Size, By Component, 2024–2036 (USD Million)
Table 56. Germany: RWD Oncology Datasets Market Size, By Type, 2024–2036 (USD Million)
Table 57. Germany: RWD Oncology Disparate Datasets Market Size, By Type, 2024–2036 (USD Million)
Table 58. Germany: RWD Oncology Solutions Market Size, By Application, 2024–2036 (USD Million)
Table 59. Germany: RWD Oncology Solutions Market Size, By End User, 2024–2036 (USD Million)
Table 60. France: RWD Oncology Solutions Market Size, By Component, 2024–2036 (USD Million)
Table 61. France: RWD Oncology Datasets Market Size, By Type, 2024–2036 (USD Million)
Table 62. France: RWD Oncology Disparate Datasets Market Size, By Type, 2024–2036 (USD Million)
Table 63. France: RWD Oncology Solutions Market Size, By Application, 2024–2036 (USD Million)
Table 64. France: RWD Oncology Solutions Market Size, By End User, 2024–2036 (USD Million)
Table 65. Italy: RWD Oncology Solutions Market Size, By Component, 2024–2036 (USD Million)
Table 66. Italy: RWD Oncology Datasets Market Size, By Type, 2024–2036 (USD Million)
Table 67. Italy: RWD Oncology Disparate Datasets Market Size, By Type, 2024–2036 (USD Million)
Table 68. Italy: RWD Oncology Solutions Market Size, By Application, 2024–2036 (USD Million)
Table 69. Italy: RWD Oncology Solutions Market Size, By End User, 2024–2036 (USD Million)
Table 70. Spain: RWD Oncology Solutions Market Size, By Component, 2024–2036 (USD Million)
Table 71. Spain: RWD Oncology Datasets Market Size, By Type, 2024–2036 (USD Million)
Table 72. Spain: RWD Oncology Disparate Datasets Market Size, By Type, 2024–2036 (USD Million)
Table 73. Spain: RWD Oncology Solutions Market Size, By Application, 2024–2036 (USD Million)
Table 74. Spain: RWD Oncology Solutions Market Size, By End User, 2024–2036 (USD Million)
Table 75. Rest Of Europe: RWD Oncology Solutions Market Size, By Component, 2024–2036 (USD Million)
Table 76. Rest Of Europe: RWD Oncology Datasets Market Size, By Type, 2024–2036 (USD Million)
Table 77. Rest Of Europe: RWD Oncology Disparate Datasets Market Size, By Type, 2024–2036 (USD Million)
Table 78. Rest Of Europe: RWD Oncology Solutions Market Size, By Application, 2024–2036 (USD Million)
Table 79. Rest Of Europe: RWD Oncology Solutions Market Size, By End User, 2024–2036 (USD Million)
Table 80. Asia-Pacific: RWD Oncology Solutions Market Size, By Country, 2024–2036 (USD Million)
Table 81. Asia-Pacific: RWD Oncology Solutions Market Size, By Component, 2024–2036 (USD Million)
Table 82. Asia-Pacific: RWD Oncology Datasets Market Size, By Type, 2024–2036 (USD Million)
Table 83. Asia-Pacific: RWD Oncology Disparate Datasets Market Size, By Type, 2024–2036 (USD Million)
Table 84. Asia-Pacific: RWD Oncology Solutions Market Size, By Application, 2024–2036 (USD Million)
Table 85. Asia-Pacific: RWD Oncology Solutions Market Size, By End User, 2024–2036 (USD Million)
Table 86. Japan: RWD Oncology Solutions Market Size, By Component, 2024–2036 (USD Million)
Table 87. Japan: RWD Oncology Datasets Market Size, By Type, 2024–2036 (USD Million)
Table 88. Japan: RWD Oncology Disparate Datasets Market Size, By Type, 2024–2036 (USD Million)
Table 89. Japan: RWD Oncology Solutions Market Size, By Application, 2024–2036 (USD Million)
Table 90. Japan: RWD Oncology Solutions Market Size, By End User, 2024–2036 (USD Million)
Table 91. China: RWD Oncology Solutions Market Size, By Component, 2024–2036 (USD Million)
Table 92. China: RWD Oncology Datasets Market Size, By Type, 2024–2036 (USD Million)
Table 93. China: RWD Oncology Disparate Datasets Market Size, By Type, 2024–2036 (USD Million)
Table 94. China: RWD Oncology Solutions Market Size, By Application, 2024–2036 (USD Million)
Table 95. China: RWD Oncology Solutions Market Size, By End User, 2024–2036 (USD Million)
Table 96. India: RWD Oncology Solutions Market Size, By Component, 2024–2036 (USD Million)
Table 97. India: RWD Oncology Datasets Market Size, By Type, 2024–2036 (USD Million)
Table 98. India: RWD Oncology Disparate Datasets Market Size, By Type, 2024–2036 (USD Million)
Table 99. India: RWD Oncology Solutions Market Size, By Application, 2024–2036 (USD Million)
Table 100. India: RWE Oncology Solutions Market Size, By End User, 2024–2036 (USD Million)
Table 101. South Korea: RWE Oncology Solutions Market Size, By Component, 2024–2036 (USD Million)
Table 102. South Korea: RWE Oncology Datasets Market Size, By Type, 2024–2036 (USD Million)
Table 103. South Korea: RWE Oncology Disparate Datasets Market Size, By Type, 2024–2036 (USD Million)
Table 104. South Korea: RWE Oncology Solutions Market Size, By Application, 2024–2036 (USD Million)
Table 105. South Korea: RWE Oncology Solutions Market Size, By End User, 2024–2036 (USD Million)
Table 106. Taiwan: RWE Oncology Solutions Market Size, By Component, 2024–2036 (USD Million)
Table 107. Taiwan: RWE Oncology Datasets Market Size, By Type, 2024–2036 (USD Million)
Table 108. Taiwan: RWE Oncology Disparate Datasets Market Size, By Type, 2024–2036 (USD Million)
Table 109. Taiwan: RWE Oncology Solutions Market Size, By Application, 2024–2036 (USD Million)
Table 110. Taiwan: RWE Oncology Solutions Market Size, By End User, 2024–2036 (USD Million)
Table 111. Singapore: RWE Oncology Solutions Market Size, By Component, 2024–2036 (USD Million)
Table 112. Singapore: RWE Oncology Datasets Market Size, By Type, 2024–2036 (USD Million)
Table 113. Singapore: RWE Oncology Disparate Datasets Market Size, By Type, 2024–2036 (USD Million)
Table 114. Singapore: RWE Oncology Solutions Market Size, By Application, 2024–2036 (USD Million)
Table 115. Singapore: RWE Oncology Solutions Market Size, By End User, 2024–2036 (USD Million)
Table 116. Australia: RWE Oncology Solutions Market Size, By Component, 2024–2036 (USD Million)
Table 117. Australia: RWE Oncology Datasets Market Size, By Type, 2024–2036 (USD Million)
Table 118. Australia: RWE Oncology Disparate Datasets Market Size, By Type, 2024–2036 (USD Million)
Table 119. Australia: RWE Oncology Solutions Market Size, By Application, 2024–2036 (USD Million)
Table 120. Australia: RWE Oncology Solutions Market Size, By End User, 2024–2036 (USD Million)
Table 121. Rest Of Asia-Pacific: RWE Oncology Solutions Market Size, By Component, 2024–2036 (USD Million)
Table 122. Rest Of Asia-Pacific: RWE Oncology Datasets Market Size, By Type, 2024–2036 (USD Million)
Table 123. Rest Of Asia-Pacific: RWE Oncology Disparate Datasets Market Size, By Type, 2024–2036 (USD Million)
Table 124. Rest Of Asia-Pacific: RWE Oncology Solutions Market Size, By Application, 2024–2036 (USD Million)
Table 125. Rest Of Asia-Pacific: RWE Oncology Solutions Market Size, By End User, 2024–2036 (USD Million)
Table 126. Latin America: RWE Oncology Solutions Market Size, By Country, 2024–2036 (USD Million)
Table 127. Latin America: RWE Oncology Solutions Market Size, By Component, 2024–2036 (USD Million)
Table 128. Latin America: RWE Oncology Datasets Market Size, By Type, 2024–2036 (USD Million)
Table 129. Latin America: RWE Oncology Disparate Datasets Market Size, By Type, 2024–2036 (USD Million)
Table 130. Latin America: RWE Oncology Solutions Market Size, By Application, 2024–2036 (USD Million)
Table 131. Latin America: RWE Oncology Solutions Market Size, By End User, 2024–2036 (USD Million)
Table 132. Brazil: RWE Oncology Solutions Market Size, By Component, 2024–2036 (USD Million)
Table 133. Brazil: RWE Oncology Datasets Market Size, By Type, 2024–2036 (USD Million)
Table 134. Brazil: RWE Oncology Disparate Datasets Market Size, By Type, 2024–2036 (USD Million)
Table 135. Brazil: RWE Oncology Solutions Market Size, By Application, 2024–2036 (USD Million)
Table 136. Brazil: RWE Oncology Solutions Market Size, By End User, 2024–2036 (USD Million)
Table 137. Mexico: RWE Oncology Solutions Market Size, By Component, 2024–2036 (USD Million)
Table 138. Mexico: RWE Oncology Datasets Market Size, By Type, 2024–2036 (USD Million)
Table 139. Mexico: RWE Oncology Disparate Datasets Market Size, By Type, 2024–2036 (USD Million)
Table 140. Mexico: RWE Oncology Solutions Market Size, By Application, 2024–2036 (USD Million)
Table 141. Mexico: RWE Oncology Solutions Market Size, By End User, 2024–2036 (USD Million)
Table 142. Rest of Latin America: RWE Oncology Solutions Market Size, By Component, 2024–2036 (USD Million)
Table 143. Rest of Latin America: RWE Oncology Datasets Market Size, By Type, 2024–2036 (USD Million)
Table 144. Rest of Latin America: RWE Oncology Disparate Datasets Market Size, By Type, 2024–2036 (USD Million)
Table 145. Rest of Latin America: RWE Oncology Solutions Market Size, By Application, 2024–2036 (USD Million)
Table 146. Rest of Latin America: RWE Oncology Solutions Market Size, By End User, 2024–2036 (USD Million)
Table 147. Middle East and Africa: RWE Oncology Solutions Market Size, By Country, 2024–2036 (USD Million)
Table 148. Middle East and Africa: RWE Oncology Solutions Market Size, By Component, 2024–2036 (USD Million)
Table 149. Middle East and Africa: RWE Oncology Datasets Market Size, By Type, 2024–2036 (USD Million)
Table 150. Middle East and Africa: RWE Oncology Disparate Datasets Market Size, By Type, 2024–2036 (USD Million)
Table 151. Middle East and Africa: RWE Oncology Solutions Market Size, By Application, 2024–2036 (USD Million)
Table 152. Middle East and Africa: RWE Oncology Solutions Market Size, By End User, 2024–2036 (USD Million)
Table 153. UAE: RWE Oncology Solutions Market Size, By Component, 2024–2036 (USD Million)
Table 154. UAE: RWE Oncology Datasets Market Size, By Type, 2024–2036 (USD Million)
Table 155. UAE: RWE Oncology Disparate Datasets Market Size, By Type, 2024–2036 (USD Million)
Table 156. UAE: RWE Oncology Solutions Market Size, By Application, 2024–2036 (USD Million)
Table 157. UAE: RWE Oncology Solutions Market Size, By End User, 2024–2036 (USD Million)
Table 158. Saudi Arabia: RWE Oncology Solutions Market Size, By Component, 2024–2036 (USD Million)
Table 159. Saudi Arabia: RWE Oncology Datasets Market Size, By Type, 2024–2036 (USD Million)
Table 160. Saudi Arabia: RWE Oncology Disparate Datasets Market Size, By Type, 2024–2036 (USD Million)
Table 161. Saudi Arabia: RWE Oncology Solutions Market Size, By Application, 2024–2036 (USD Million)
Table 162. Saudi Arabia: RWE Oncology Solutions Market Size, By End User, 2024–2036 (USD Million)
Table 163. South Africa: RWE Oncology Solutions Market Size, By Component, 2024–2036 (USD Million)
Table 164. South Africa: RWE Oncology Datasets Market Size, By Type, 2024–2036 (USD Million)
Table 165. South Africa: RWE Oncology Disparate Datasets Market Size, By Type, 2024–2036 (USD Million)
Table 166. South Africa: RWE Oncology Solutions Market Size, By Application, 2024–2036 (USD Million)
Table 167. South Africa: RWE Oncology Solutions Market Size, By End User, 2024–2036 (USD Million)
Table 168. Rest of Middle East and Africa: RWE Oncology Solutions Market Size, By Component, 2024–2036 (USD Million)
Table 169. Rest of Middle East and Africa: RWE Oncology Datasets Market Size, By Type, 2024–2036 (USD Million)
Table 170. Rest of Middle East and Africa: RWE Oncology Disparate Datasets Market Size, By Type, 2024–2036 (USD Million)
Table 171. Rest of Middle East and Africa: RWE Oncology Solutions Market Size, By Application, 2024–2036 (USD Million)
Table 172. Rest of Middle East and Africa: RWE Oncology Solutions Market Size, By End User, 2024–2036 (USD Million)
LIST OF FIGURES
Figure 1. Research Process
Figure 2. Key Secondary Sources
Figure 3. Primary Research Techniques
Figure 4. Key Executives Interviewed
Figure 5. Breakdown Of Primary Interviews (Supply-Side & Demand-Side)
Figure 6. Market Sizing and Growth Forecast Approach
Figure 7. Global RWE Oncology Solutions Market, By Component, 2026 Vs. 2036 (USD Million)
Figure 8. Global RWE Oncology Solutions Market, By Application, 2026 Vs. 2036 (USD Million)
Figure 9. Global RWE Oncology Solutions Market, By End User, 2026 Vs. 2036 (USD Million)
Figure 10. RWE Oncology Solutions Market, By Geography, 2026 Vs. 2036 (USD Million)
Figure 11. Factors Affecting Market Growth
Figure 12. Global RWE Oncology Solutions Market, By Component, 2026 Vs. 2036 (USD Million)
Figure 13. Global RWE Oncology Solutions Market, By Application, 2026 Vs. 2036 (USD Million)
Figure 14. Global RWE Oncology Solutions Market, By End User, 2026 Vs. 2036 (USD Million)
Figure 15. Global RWE Oncology Solutions Market, By Region, 2026 Vs. 2036 (USD Million)
Figure 16. North America: RWE Oncology Solutions Market Snapshot
Figure 17. Europe: RWE Oncology Solutions Market Snapshot
Figure 18. Asia-Pacific: RWE Oncology Solutions Market Snapshot
Figure 19. Competitive Dashboard: RWE Oncology Solutions Market
Figure 20. RWE Oncology Solutions Market Position Analysis, 2024
Figure 21. Iqvia Holdings Inc.: Financial Overview (2025)
Figure 22. Veracyte, Inc: Financial Overview (2025)
Figure 23. Ibm Corporation: Financial Overview (2025)
Figure 24. Oracle Corporation: Financial Overview (2025)
Figure 25. Icon Plc.: Financial Overview (2024)
Figure 26. Cognizant Technology Solutions Corporation: Financial Overview (2025)
Figure 27. Unitedhealth Group Incorporated: Financial Overview (2024)
Figure 28. Anthem, Inc.: Financial Overview (2024)
Figure 29. Tempus Labs, Inc.: Financial Overview (2024)


Published Date: Mar-2026
Published Date: Feb-2026
Published Date: Jan-2025
Published Date: Mar-2016
Subscribe to get the latest industry updates