Logistics Visibility Platforms Market (2026-2036)
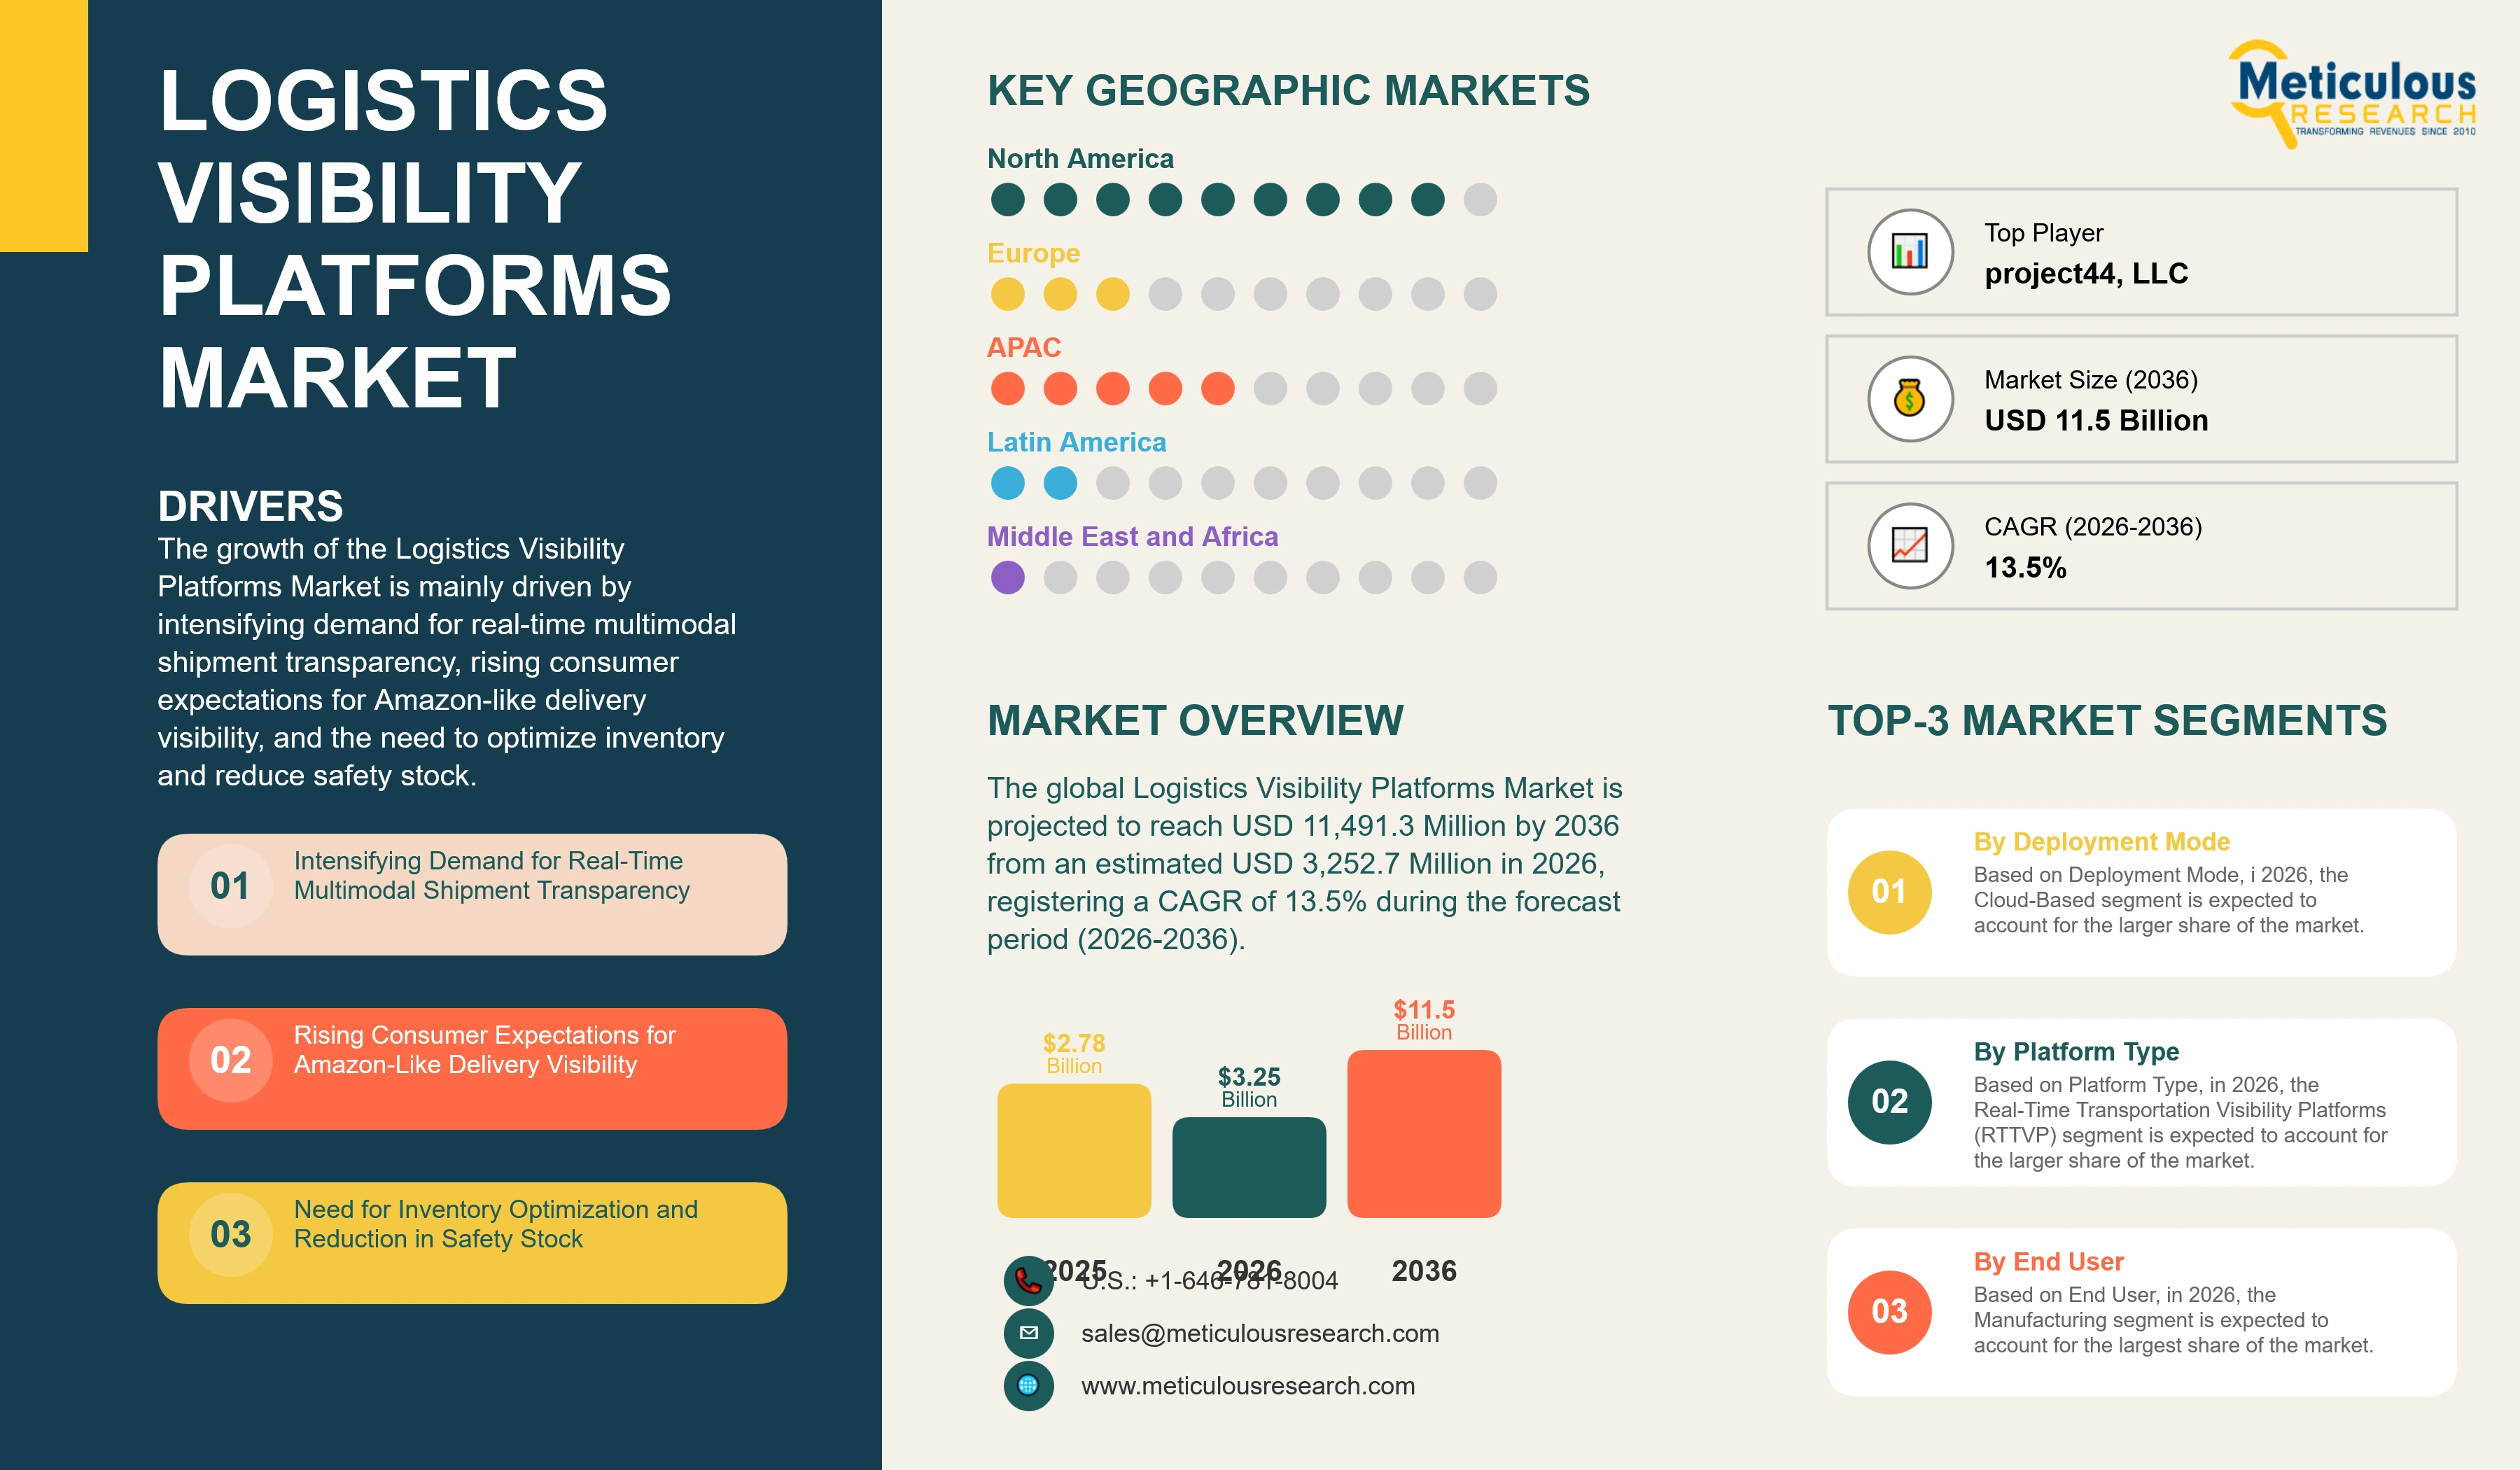
The global Logistics Visibility Platforms Market was valued at USD 2,779.9 million in 2025. This market is expected to reach USD 11,491.3 million by 2036 from an estimated USD 3,252.7 million in 2026, at a CAGR of 13.5% during the forecast period (2026-2036).
- Published
- Nov 2026
- Pages
- 277
- Format
- PDF + Excel
- Report ID
- MRAUTO - 1042055
- Base year
- 2025
- 2024 · HISTORICAL
- $2.40B
- 2036
- $11.49B
- CAGR 2026–2036
- 13.5%
2024–2025 baseline · 2026–2036 forecast at 13.5% CAGR · hover a bar for the value
Key highlights
The global Logistics Visibility Platforms Market is projected to reach USD 11, 491.3 million by 2036 from an estimated USD 3,252.7 million in 2026, at a CAGR of 13.5%. The market grew from USD 2,402.3 million in 2024 to USD 2,779.9 million in 2025, led by ocean disruptions, new AI features, and wider use of tracking by retailers.
Growth of 17.0% in 2026 is the fastest of the forecast period. Growth is expected to ease to 12.0% by 2036, as large shippers complete their first rollouts and prices for basic tracking come under pressure.
By deployment mode, the cloud-based segment is expected to account for the larger share of 90.5% in 2026 and to register the higher CAGR of 13.9%, as carrier networks, vessel data, and AI models are delivered as shared multi-tenant services.
By platform type, real-time transportation visibility platforms (RTTVP) are expected to account for the larger share of 59.1% in 2026, while end-to-end supply chain visibility (SCV) platforms are projected to register the higher CAGR of 14.6%.
By transportation mode, road freight (FTL & LTL) is expected to account for the largest share of 39.7% in 2026, while ocean freight is projected to register the highest CAGR of 14.7%, driven by longer and less predictable ocean routes.
By end user, manufacturing is expected to account for the largest share of 27.3% in 2026, while retail & e-commerce is projected to register the highest CAGR of 15.3%, supported by online sales growth and delivery promise tools.
North America is expected to account for the largest share of 41.9% of the market in 2026, and the U.S. is the largest country market in every year of the forecast period. Asia-Pacific is projected to register the highest CAGR of 15.8%, and India is the fastest-growing country, at a CAGR of 19.1%.
project44, LLC is estimated to have led the market in 2025 with a share of 4.2%, followed by FourKites, Inc. (3.1%) and The Descartes Systems Group Inc. (2.7%). The 20 profiled companies announced 86 verified developments between January 2024 and October 2026, led by 43 product launches.
Report summary
| Particulars | Details |
|---|---|
| Forecast Period | 2026-2036 |
| Base Year | 2025 |
| Estimated Year | 2026 |
| Historical Years | 2024-2025 |
| CAGR (2026-2036) | 13.5% |
| Format | PDF, Excel & Cloud Portal · 277 pages |
| Market Size in 2025 | USD 2,779.9 Million |
| Market Size in 2026 | USD 3,252.7 Million |
| Market Size in 2036 | USD 11,491.3 Million |
| Segments Covered | By Deployment Mode: Cloud-Based, On-Premise. By Platform Type: Real-Time Transportation Visibility Platforms (RTTVP), End-to-End Supply Chain Visibility (SCV) Platforms. By Transportation Mode: Road Freight (FTL & LTL), Ocean Freight, Air Freight, Rail & Intermodal, Parcel & Last-Mile. By End User: Manufacturing, Retail & E-commerce, Food & Beverage, Pharmaceutical & Healthcare, Logistics & Transportation (LSPs), Others. |
| Countries Covered | North America: U.S., Canada. Europe: Germany, U.K., France, Italy, Spain, Netherlands, Rest of Europe. Asia-Pacific: China, Japan, India, South Korea, Australia, Singapore, Rest of Asia-Pacific. Latin America: Brazil, Mexico, Argentina, Rest of Latin America. Middle East & Africa: UAE, Saudi Arabia, Rest of Middle East & Africa. |
| Key Companies | project44, FourKites, Descartes, Blue Yonder, e2open, SAP, Trimble, Oracle, Shippeo, Tive, Overhaul, Resilinc, Everstream Analytics, FarEye, Decklar, Vizion, Terminal49, Logixboard, Freightos, and Arviem. |
Report overview
Segments covered: deployment mode, platform type, transportation mode, end user.
The growth of this market is mainly driven by intensifying demand for real-time multimodal shipment transparency, rising consumer expectations for Amazon-like delivery visibility, and the need to optimize inventory and reduce safety stock. However, the fragmented carrier landscape with uneven data quality, and the high complexity and cost of integration with legacy systems, restrain the growth of this market.
Furthermore, AI-driven prescriptive analytics for autonomous exception management and the expansion of platforms into sustainability and Scope 3 emissions tracking are expected to offer growth opportunities for market stakeholders. However, data security, privacy, and data ownership concerns, together with the difficulty of proving ROI and moving beyond pilot deployments, remain major challenges. The convergence of visibility and execution within unified platforms and an increased focus on granular SKU-level and order-level visibility are key trends in this market.
The Logistics Visibility Platforms Market covers the sales value of software platforms that give shippers, retailers, and logistics service providers (LSPs) live status, predictive ETAs, and exception alerts for freight. Value includes platform subscriptions, usage fees, implementation and integration services, and tracker-as-a-service bundled with a visibility platform. Standalone tracker hardware, fleet telematics and ELD services, core transportation management systems (TMS), freight brokerage, and in-house tools of LSPs are excluded.
Two platform types are covered. Real-time transportation visibility platforms (RTTVP) track shipments in transit across road, ocean, air, rail, and parcel moves by combining carrier, telematics, vessel, port, and airline data. End-to-end supply chain visibility (SCV) platforms link transport data with orders, inventory, and supplier networks, and include control towers and supply chain risk monitoring. Market value is assigned to the country where the platform is bought and billed.
Demand is set by manufacturers, retailers, food and beverage and pharmaceutical companies, and LSPs that need to see freight moving across many carriers and modes. Disruption has made this need urgent. The Strait of Hormuz was declared closed in late February 2026, and project44 recorded more than 34,000 route diversions in the first four weeks of the disruption. U.S. tariffs changed on average every 1.5 weeks in 2025, according to the 2026 State of Logistics Report of the Council of Supply Chain Management Professionals (CSCMP).
Vendors are moving from showing exceptions to resolving them. project44 launched Autopilot, a no-code platform for AI agents, in May 2026, and FourKites launched its Loft AI platform in February 2026. At the same time, visibility and execution software are converging, as WiseTech Global completed its USD 2.1 billion acquisition of e2open in August 2025 and Shippeo acquired Logward in May 2026.
“When the Gulf routes closed, we needed to know container by container where our parts would land and when. We now track ocean, road, and rail legs in one view and plan production around predicted arrivals instead of carrier schedules.”
This reflects why demand for real-time multimodal shipment transparency is the main driver and why manufacturing is the largest end user.
“Our customers expect the same delivery dates they get from the largest online sellers. Linking order data with carrier events cut our where-is-my-order calls and lets us warn customers before a delay becomes a complaint.”
This highlights why retail & e-commerce is the fastest-growing end user and why consumer delivery expectations drive the market.
“Our pilot showed good results on a few lanes, but scaling it meant onboarding hundreds of small carriers and integrating three ERP systems. We now ask vendors for guaranteed data quality before we expand.”
This indicates why carrier fragmentation and integration cost are key restraints and why proving ROI beyond pilots remains a challenge.
“We moved from watching dashboards to letting agents handle routine exceptions such as missing updates and late pickups. Our team now spends its time on the shipments that really need a decision.”
This reflects why AI-driven exception management is a key opportunity and why visibility and execution are converging within unified platforms.
Report infographic
Market dynamics
11 factors across 5 forcesIntensifying Demand for Real-Time Multimodal Shipment Transparency
Shippers now need live status across ocean, road, air, and rail, because disruptions move from one mode to the next within days. The Strait of Hormuz was declared closed in late February 2026, according to gCaptain (March 2026). According to project44 (March 10, 2026), average daily ocean freight diversions rose by more than 360%, from a baseline of 218 to about 1,010 per day. Transshipment volume at Navi Mumbai rose more than 700% against February baselines, according to project44 (March 31, 2026). In a FourKites survey released in January 2025, 8 in 10 U.S. supply chain leaders had less than 75% of their supply chain available in real time. Visibility platforms close this gap by combining carrier, telematics, vessel, port, and airline data into one view.
Rising Consumer Expectations for Amazon-Like Delivery Visibility
Online buying keeps growing, and every parcel order creates a tracking need for the end customer. According to the U.S. Census Bureau (August 2026), U.S. retail e-commerce sales reached USD 340.2 billion in the second quarter of 2026, 12.2% higher than a year earlier. Amazon reported in February 2026 that it delivered over 13 billion items worldwide on the same or next day in 2025. Descartes reported in May 2025 that 66% of 8,000 consumers surveyed in Europe and North America had experienced delivery problems. Retailers and brands therefore link order data with carrier events to give buyers accurate delivery dates.
Need for Inventory Optimization and Reduction in Safety Stock
Inventory carrying cost and working capital have become central reasons to buy visibility platforms. According to the U.S. Census Bureau (October 2026), U.S. total business inventories reached USD 2,818.8 billion in August 2026, and the inventories-to-sales ratio fell to 1.33 from 1.40 a year earlier. In FourKites research of October 2025, 27.6% of supply chain professionals named working capital optimization as their top investment driver. Accurate arrival times let planners hold smaller buffers and use in-transit stock earlier.
Table of contents
12 chapters · 143 sections · 277 pages · click to expandSegmental analysis
| Segment | Largest share (2026) | Fastest growth (2026–2036) |
|---|---|---|
| By Deployment Mode | — | — |
| By Platform Type | — | — |
| By Transportation Mode | Road Freight (FTL & LTL) | Ocean Freight |
| By End User | Manufacturing | Retail & E-commerce |
By Deployment Mode
- The Cloud-Based segment is expected to account for the larger share of 90.5% of the market, valued at USD 2,945.1 million.
- The large share of this segment is mainly due to the network design of visibility platforms, which connect carriers, telematics providers, ports, and airlines to many shippers.
- Shippeo reported in November 2025 that its network integrates more than 228, 000 carriers and 1,100 TMS, telematics, and ELD systems.
- The Cloud-Based segment is also projected to register the higher CAGR of 13.9% during the forecast period.
- This growth is mainly driven by AI features such as predictive ETAs, AI agents, and conversational analysts, which vendors deliver through their SaaS platforms.
- The On-Premise segment grows at a CAGR of 7.3% and consists mainly of event management functions within licensed supply chain suites, with a stable base of demand from buyers with data residency and security needs.
By Platform Type
- The RTTVP segment is expected to account for the larger share of 59.1% of the market, valued at USD 1,921.1 million.
- The large share of this segment is mainly due to its role as the entry point for most visibility programs. project44 reported in May 2026 that its network covers more than 282,000 carriers and more than 1.5 billion shipments a year in 186 countries and territories.
- However, the SCV segment is projected to register the higher CAGR of 14.6% during the forecast period.
- This growth is mainly driven by rising disruption risk, which pushes companies to connect shipment data with orders, inventory, and supplier networks.
- Resilinc reported 26, 225 disruption alerts in 2025, up 38% from 2024.
- Blue Yonder completed the acquisition of One Network Enterprises in August 2024, and RTTVP vendors such as FourKites and project44 are also adding control tower and decision intelligence functions.
By Transportation Mode
- The Road Freight (FTL & LTL) segment is expected to account for the largest share of 39.7% of the market, valued at USD 1,290.6 million.
- The large share of this segment is mainly due to trucking dominance in domestic freight and the wide use of ELD and telematics data.
- The American Trucking Associations (ATA) estimated that trucks moved about 11.27 billion tons of U.S. freight in 2024.
- However, the Ocean Freight segment is projected to register the highest CAGR of 14.7% during the forecast period.
- This growth is mainly driven by longer and less predictable ocean routes and by higher charges for containers that stay too long at ports.
- UNCTAD reported that tonnage through the Suez Canal in May 2025 was 70% below 2023 levels, and the demurrage and detention billing rule of the Federal Maritime Commission (FMC) took full effect on May 28, 2024.
- The Parcel & Last-Mile and Air Freight segments also grow faster than the market, at CAGRs of 14.4% and 14.2%.
By End User
- The Manufacturing segment is expected to account for the largest share of 27.3% of the market, valued at USD 887.8 million.
- The large share of this segment is mainly due to the complex inbound and outbound flows of automotive, industrial, and high-tech producers, where a late part can stop a production line.
- Kawasaki Heavy Industries selected project44 in January 2024 to track tens of thousands of container shipments a year.
- However, the Retail & E-commerce segment is projected to register the highest CAGR of 15.3% during the forecast period.
- This growth is mainly driven by online sales growth, faster delivery expectations, and the need to give consumers accurate delivery dates.
- The Pharmaceutical & Healthcare segment records the second-highest growth, at a CAGR of 14.2%, driven by temperature-sensitive products and traceability rules, while the Logistics & Transportation (LSPs) segment grows slowest, at a CAGR of 12.3%.
Geographic analysis
North America
Largest shareIn 2026, North America is expected to account for the largest share of 41.9% of the market, valued at USD 1,361.9 million, and to grow at a CAGR of 12.2%. The large share of this region is mainly due to early adoption of real-time tracking by large U.S. shippers and by carriers that record driving data on ELDs. Truck freight between the U.S., Canada, and Mexico was worth about USD 1.0 trillion in 2025, according to the Bureau of Transportation Statistics. The U.S. is the largest country market in every year, while Canada grows faster, at a CAGR of 12.6%. Mexico was the top U.S. trading partner for goods in 2025, according to the Congressional Research Service. Cargo theft also drives demand, as about 82% of robberies against Mexican transporters in 2025 involved violence, according to an Overhaul report. North America
Asia-Pacific
Fastest growthAsia-Pacific is expected to account for a share of 24.8% of the market in 2026, valued at USD 807.0 million. However, it is projected to register the highest CAGR of 15.8% among all regions, and its share is expected to rise to 30.4% by 2036. China is the largest market in the region, and it handled 199.0 billion express parcels in 2025, according to the National Bureau of Statistics. India is projected to register the highest CAGR among all countries, at 19.1%, supported by its National Logistics Policy of September 2022. Asia-Pacific
Europe
Europe is expected to account for a share of 23.9% of the market in 2026, valued at USD 776.3 million, and to grow at a CAGR of 12.4%. Road haulage dominates European freight, with 1,886 billion tonne-kilometers carried by EU trucks in 2025, according to Eurostat. Germany is the largest country market in the region, while Spain is projected to grow fastest, at a CAGR of 13.0%. The EU eFTI Regulation applies in full from July 9, 2027, which moves transport documents into digital form and makes shipment status data easier to capture. Europe
Latin America
Latin America is expected to account for a share of 5.7% of the market in 2026, valued at USD 184.5 million, and to grow at a CAGR of 14.6%. Brazil is the largest market in the region, while Mexico is projected to grow fastest, at a CAGR of 15.4%. Latin America
Middle East & Africa
The Middle East & Africa is expected to account for a share of 3.8% of the market in 2026, valued at USD 123.0 million, and to grow at a CAGR of 14.9%. The UAE is the largest named country market in the region, while Saudi Arabia is projected to grow fastest, at a CAGR of 16.0%, supported by its national transport and logistics strategy. Trade corridors, cargo security, and national logistics programs are the main sources of demand. Middle East & Africa
Competitive landscape
The global Logistics Visibility Platforms Market is fragmented overall, as no single provider covers every transport mode, data source, and buyer group. The core real-time transportation visibility space is more concentrated, as a few providers led by project44 win most large enterprise contracts. project44, LLC is estimated to have led the market in 2025 with a share of 4.2%, followed by FourKites, Inc. (3.1%), The Descartes Systems Group Inc. (2.7%), Blue Yonder Group, Inc. (2.3%), E2open Parent Holdings, Inc. (2.2%), and SAP SE (1.8%), while other players accounted for 83.7%.
Between January 2024 and October 2026, the 20 companies profiled in the report announced 86 verified developments related to logistics visibility platforms. Product launches (43) were the most common approach, followed by partnerships (17), agreements and contracts (8), expansions (8), acquisitions (5), and investments (5). Product launches centered on AI agents and tools that act on exceptions, while acquisitions added execution and planning capabilities to visibility.
The report provides a comprehensive competitive assessment of the leading companies operating in the global Logistics Visibility Platforms Market. The key players profiled in the report include project44, LLC (U.S.), FourKites, Inc. (U.S.), The Descartes Systems Group Inc. (Canada), Blue Yonder Group, Inc. (U.S.), E2open Parent Holdings, Inc. (U.S.), SAP SE (Germany), Trimble Inc. (U.S.), Oracle Corporation (U.S.), Shippeo SAS (France), Tive, Inc. (U.S.), Overhaul Group, Inc. (U.S.), Resilinc Corporation (U.S.), Everstream Analytics, Inc. (U.S.), FarEye Technologies Private Limited (India), Decklar Corporation (U.S.), Vizion API, Inc. (U.S.), Terminal49, Inc. (U.S.), Logixboard, Inc. (U.S.), Freightos Limited (Cayman Islands), and Arviem AG (Switzerland).
- FourKites
- Descartes
- Blue Yonder
- SAP
- Trimble
- Oracle
- Shippeo
- Tive
- Overhaul
- Resilinc
- Everstream Analytics
- FarEye
- Decklar
- Vizion
- Terminal49
- Logixboard
- Freightos
- Arviem
Expert perspectives
Logistics visibility is moving from tracking to action. The end-to-end supply chain visibility (SCV) segment is projected to raise its share from 40.9% in 2026 to 45.4% in 2036, as buyers link shipment data with orders, inventory, and suppliers. Cloud-based platforms are expected to reach 94.6% of the market by 2036, because AI agents and predictive ETAs depend on pooled network data.
Ocean, parcel, and air visibility are the fastest-growing modes, as longer ocean routes, chokepoint closures, and e-commerce raise the cost of not knowing where freight is. Ocean freight raises its share from 24.3% in 2026 to 27.0% in 2036, while road freight remains the largest mode. Retail & e-commerce raises its share from 21.3% to 25.0%, closing the gap with manufacturing.
Asia-Pacific raises its share from 24.8% in 2026 to 30.4% in 2036, led by China and by India, the fastest-growing country market. North America remains the largest region, but its share eases as adoption matures among large U.S. shippers. Annual growth peaks at 17.0% in 2026 and eases to 12.0% by 2036.
For vendors, the strongest positions are likely to belong to providers that combine broad carrier connectivity, high data quality, and AI-based exception handling with links to the planning and execution systems of their customers. Data rules, carrier onboarding costs, and proof of ROI remain the main risks, so vendors with SLA-backed data quality and certified ERP integrations are well placed to move customers beyond pilots.
Customer perspectives
Primary interviews were held with supply chain, logistics, and transportation leaders at manufacturers, retailers, food and beverage and pharmaceutical companies, and LSPs. Product, sales, and network executives at transportation visibility vendors, supply chain visibility and control tower vendors, IoT tracking providers, and system integrators were also interviewed. The quotes below are representative of the views shared and are attributed to generic roles.
Frequently asked questions
The global Logistics Visibility Platforms Market is estimated at USD 3,252.7 million in 2026, up from USD 2,779.9 million in 2025.
Cite this report
Meticulous Research. (2026). Logistics Visibility Platforms Market - Global Opportunity Analysis and Industry Forecast (2026-2036) (Report No. MRAUTO - 1042055). Meticulous Market Research Pvt. Ltd. https://www.meticulousresearch.com/product/logistics-visibility-platforms-market-6738