
Power Quality Equipment Market (2026-2036)
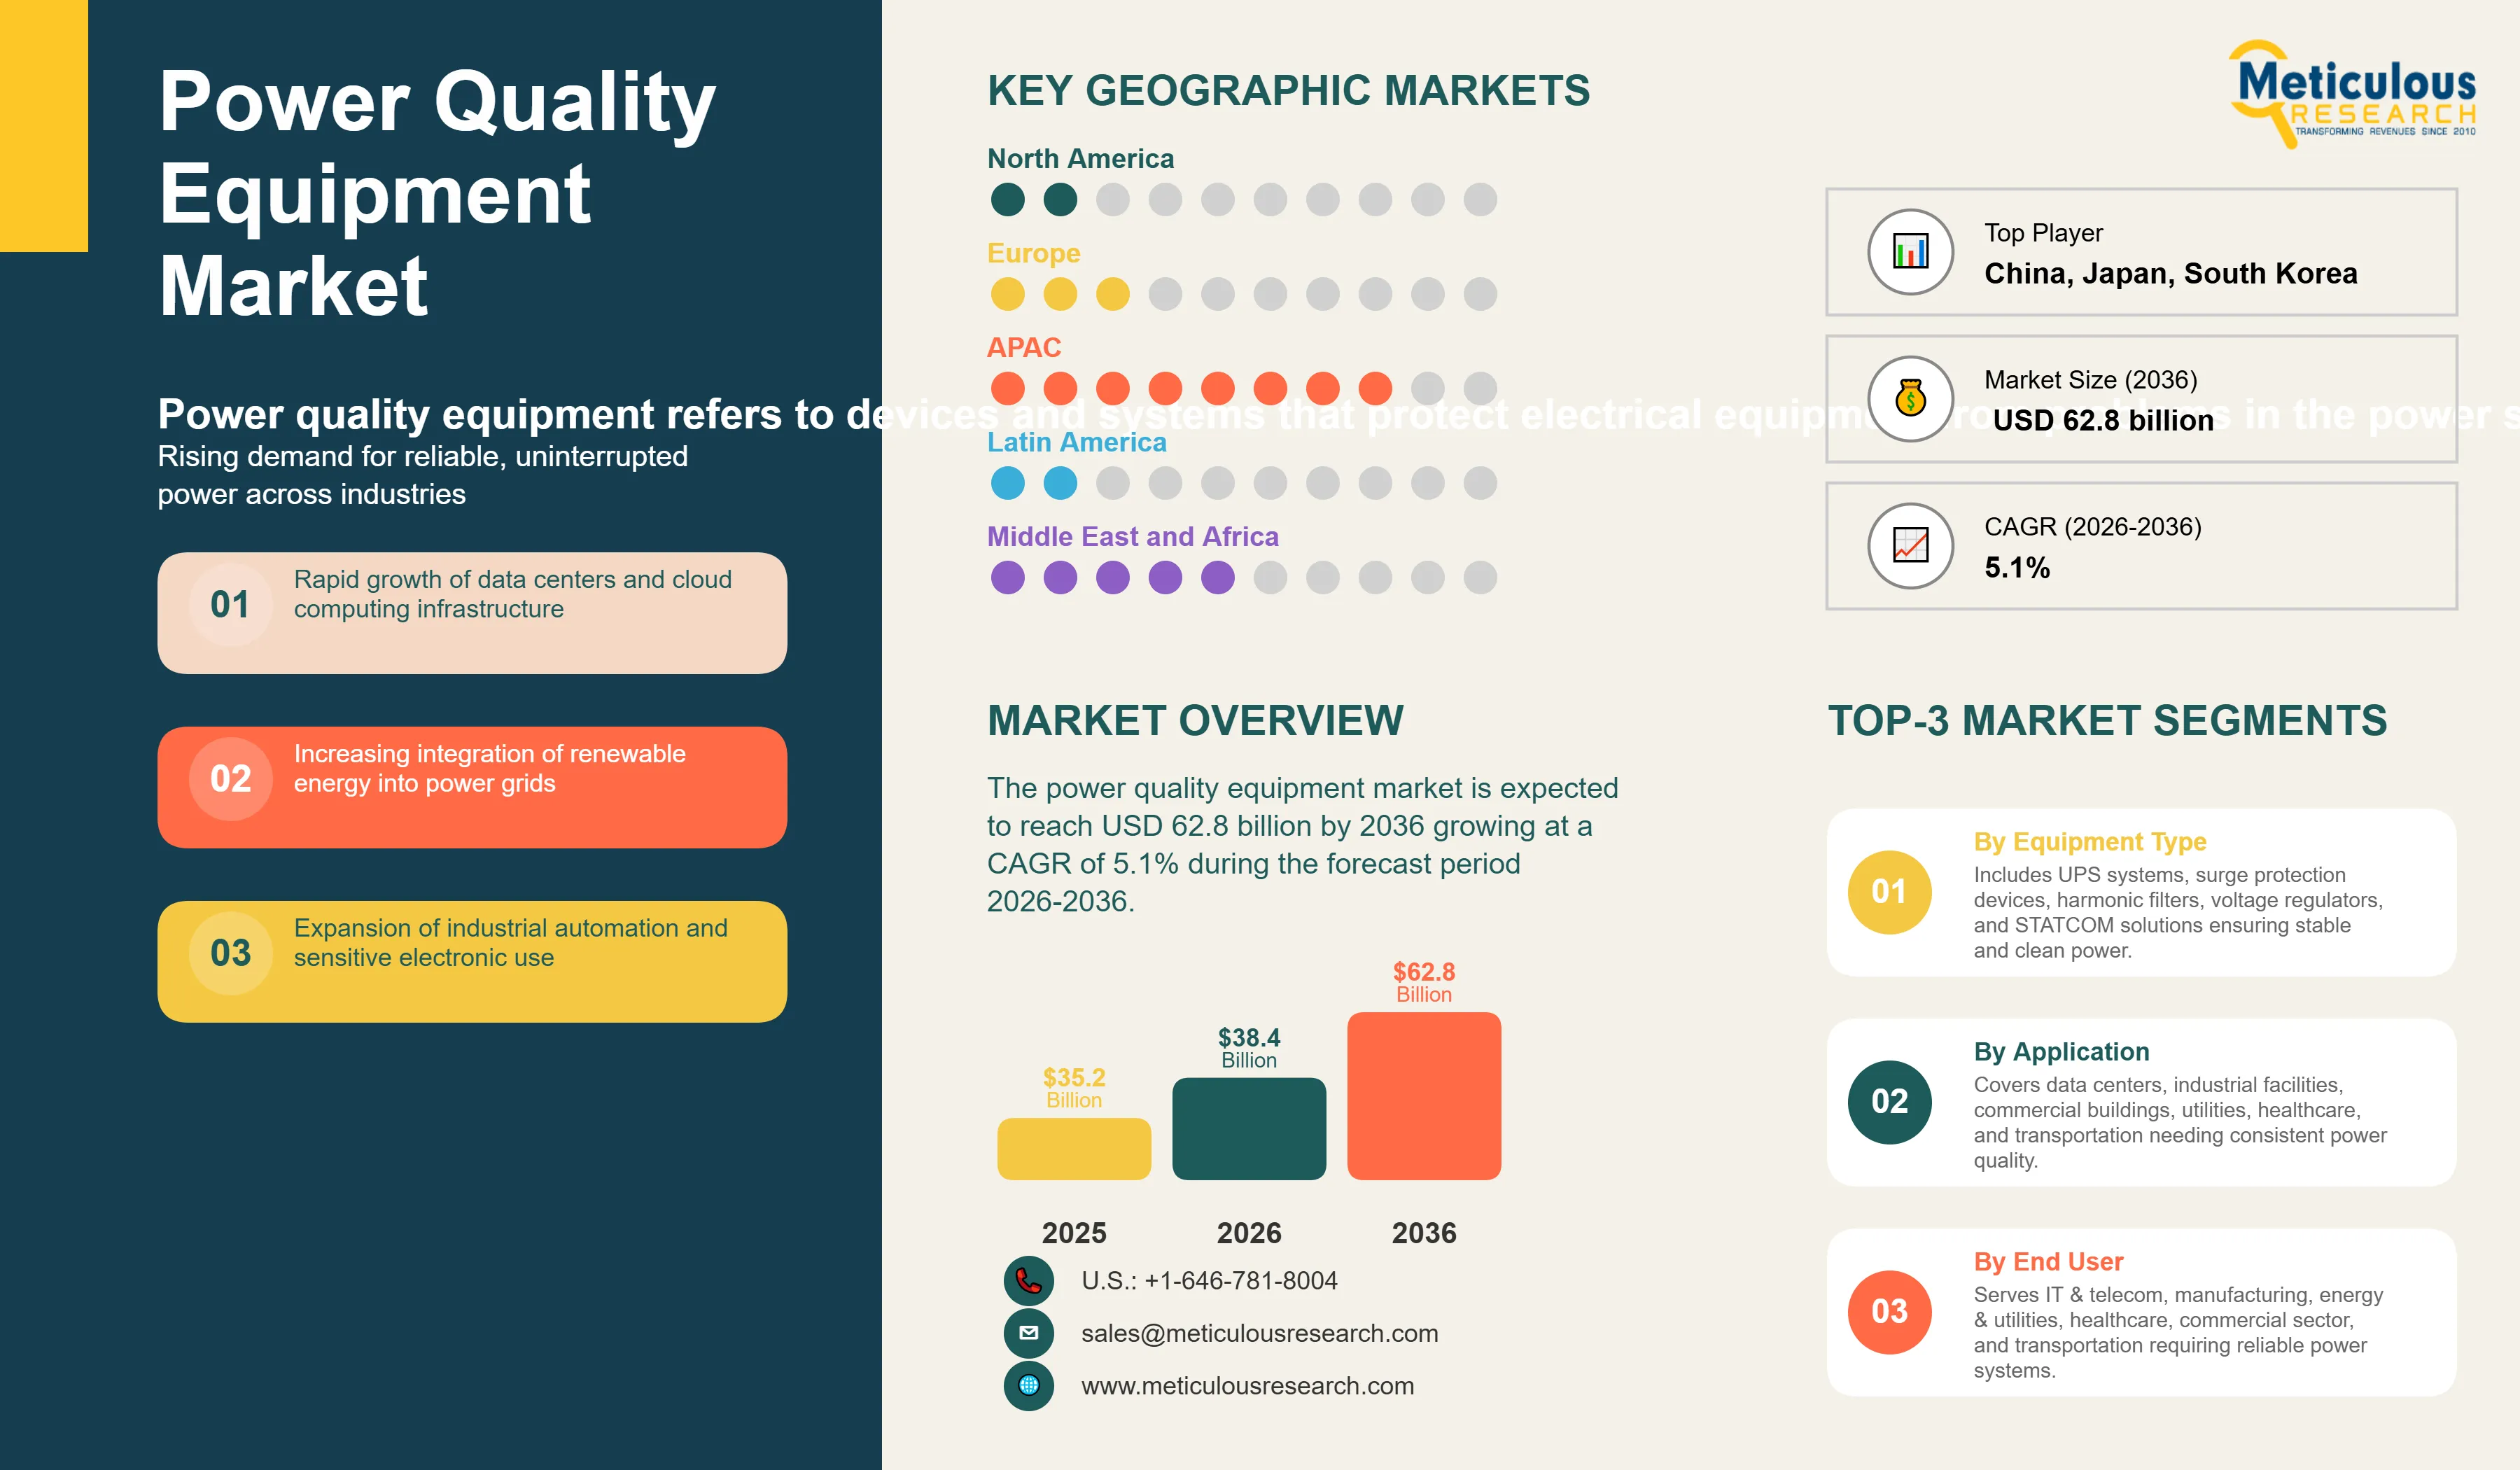
The global power quality equipment market was valued at USD 35.2 billion in 2025. This market is expected to reach USD 62.8 billion by 2036 from an estimated USD 38.4 billion in 2026, growing at a CAGR of 5.1% during the forecast period 2026-2036.
- Published
- Apr 2026
- Pages
- 278
- Format
- PDF + Excel
- Report ID
- MREP - 1041942
- Base year
- 2025
- 2025 · BASELINE
- $35.20B
- 2036
- $62.80B
- CAGR 2026–2036
- 5.1%
2025 baseline · 2026–2036 forecast at 5.1% CAGR · hover a bar for the value
Key highlights
The global power quality equipment market is projected to reach USD 62.8 billion by 2036.
The market is expected to grow at a CAGR of 5.1% during the forecast period 2026-2036.
The global market for power quality equipment was valued at USD 35.2 billion in 2025 and is estimated to reach USD 38.4 billion in 2026.
Asia-Pacific is expected to dominate the global power quality equipment market with the largest market share in 2026, while the Middle East and Africa is projected to register the highest CAGR during the forecast period.
By equipment type, the UPS segment is expected to hold the largest share of the market in 2026, while the SVC and STATCOM segment is projected to register the highest CAGR during the forecast period.
By disturbance type, the voltage sag and swell segment is expected to hold the largest share in 2026, while the harmonics segment is projected to register the highest CAGR during the forecast period.
By application, the data centers segment is expected to hold the largest share in 2026, while the utilities and power generation segment is projected to register the highest CAGR during the forecast period.
By end-use industry, the IT and telecommunications segment is expected to hold the largest share in 2026, while the energy and utilities segment is projected to register the highest CAGR during the forecast period.
By voltage level, the low voltage segment is expected to hold the largest share in 2026, while the medium voltage segment is projected to register the highest CAGR during the forecast period.
By phase type, the three-phase systems segment is expected to hold the largest share in 2026, while the single-phase systems segment is projected to register the highest CAGR during the forecast period.
Report summary
| Particulars | Details |
|---|---|
| Market Size by 2036 | USD 62.8 Billion |
| Market Size in 2026 | USD 38.4 Billion |
| Market Size in 2025 | USD 35.2 Billion |
| Revenue Growth Rate (2026-2036) | CAGR of 5.1% |
| Format | PDF, Excel & Cloud Portal · 278 pages |
| Dominating Equipment Type | Uninterruptible Power Supply (UPS) |
| Fastest Growing Equipment Type | Static VAR Compensators (SVC) and STATCOM |
| Dominating Disturbance Type | Voltage Sag and Swell |
| Fastest Growing Disturbance Type | Harmonics |
| Dominating Application | Data Centers |
| Fastest Growing Application | Utilities and Power Generation |
| Dominating End-Use Industry | IT & Telecommunications |
| Fastest Growing End-Use Industry | Energy & Utilities |
| Dominating Voltage Level | Low Voltage |
| Fastest Growing Voltage Level | Medium Voltage |
| Dominating Phase Type | Three-Phase Systems |
| Fastest Growing Phase Type | Single-Phase Systems |
| Dominating Geography | Asia-Pacific |
| Fastest Growing Geography | Middle East & Africa |
| Base Year | 2025 |
| Forecast Period | 2026 to 2036 |
Report overview
Segments covered: equipment type, disturbance type, application, end-use industry.
Power quality equipment refers to devices and systems that protect electrical equipment from problems in the power supply, such as voltage spikes, sags, harmonics, and outages. When the electricity coming from the grid is unstable or contaminated with electrical noise, sensitive equipment like computers, medical devices, industrial machinery, and data center servers can be damaged, produce errors, or fail unexpectedly. Power quality equipment solves this by cleaning, stabilizing, and protecting the power supply before it reaches the end equipment.
The market is growing because modern facilities depend on increasingly sensitive electronics that cannot tolerate poor power quality. Data centers running 24/7 for cloud services and e-commerce cannot afford even a second of downtime. Hospitals need uninterrupted and clean power for life-critical equipment. Automated factories with precision robots and drives fail or produce defective output when voltage fluctuates. At the same time, the rapid expansion of solar and wind energy is introducing new power quality challenges because these intermittent sources inject electrical disturbances into grids that were designed for steady fossil fuel generation, creating growing demand for reactive compensation and harmonic filtering equipment.
Two key opportunities are shaping the market's next phase. The global explosion of hyperscale data center construction by Amazon, Microsoft, Google, and Meta is generating very large and concentrated procurement of UPS systems and power conditioning equipment in a way that no other application segment matches. Simultaneously, the development of smart grid infrastructure with digital power monitoring and AI-based predictive maintenance is creating a new generation of intelligent power quality systems that deliver both protection and real-time grid health insights, commanding premium pricing and growing enterprise adoption.
Report infographic
Digitalization and AI Transforming Power Quality into a Smart System
Power quality equipment is evolving from passive protective devices into actively monitored and intelligently managed systems that provide real-time insight into power health across entire facilities and grids. Modern UPS systems and power conditioning equipment include embedded sensors, communication interfaces, and cloud connectivity that continuously transmit operational data to monitoring platforms. AI-based analytics can analyze this data to detect developing problems, predict equipment failures before they occur, and optimize power management to reduce energy losses.
Schneider Electric's EcoStruxure Power platform, ABB's Ability power monitoring, and Eaton's Brightlayer platform are leading examples of this shift toward digital power quality management. For large industrial and commercial facilities, digital power quality management converts what was previously a break-fix maintenance activity into proactive performance management that reduces unplanned downtime and improves energy efficiency. This digital premium offering is enabling equipment manufacturers to grow per-customer revenue beyond hardware sales through subscription-based monitoring services that generate recurring revenue streams.
Market dynamics
6 factors across 4 forcesGrowth of Sensitive Electronic Equipment and Data Centers
Modern industrial, commercial, and institutional facilities operate with far more sensitive electronic equipment than was typical two decades ago. Industrial drives, robotics, programmable logic controllers, and precision instruments require clean, stable power to function correctly and are vulnerable to damage from voltage transients and sags. Healthcare facilities depend on power quality for imaging equipment, life support systems, and electronic patient records. The global explosion of data center investment to support cloud computing, AI, and digital services is the most concentrated and commercially significant driver: a single hyperscale data center can require more than USD 100 million of UPS and power conditioning equipment, and dozens of these facilities are being built or expanded annually. The irreversibility of the global shift toward digitally intensive operations means the demand for reliable, clean power is a permanent and growing feature of the market.
Rising Integration of Renewable Energy Sources
Solar and wind power integration is growing rapidly in every major electricity market globally, driven by falling technology costs and government decarbonization commitments. These sources introduce voltage variability and harmonic distortion into grids that require active management through reactive power compensation and filtering equipment. National targets for renewable energy penetration above 50% of generation capacity, set by several European countries and increasingly by Asian and emerging market governments, create mandatory and quantifiable power quality equipment procurement requirements for utilities that must maintain grid stability under growing proportions of intermittent generation. This regulatory and operational driver is creating a structural and growing demand base for medium and high voltage power quality equipment at the grid infrastructure level that is distinct from the facility-level UPS and conditioning markets.
Table of contents
14 chapters · 186 sections · 278 pages · click to expandSegmental analysis
| Segment | Largest share (2026) | Fastest growth (2026–2036) |
|---|---|---|
| By Equipment Type | UPS | SVC and STATCOM |
| By Disturbance Type | Voltage Sag and Swell | Harmonics |
| By End-Use Industry | — | Energy and utilities |
By Equipment Type
- UPS to Dominate
- The global market for power quality equipment is segmented into uninterruptible power supply systems, surge protection devices, harmonic filters, static VAR compensators and STATCOM, voltage regulators and stabilizers, and power conditioners and isolation transformers.
- The UPS segment is expected to account for the largest share of the global power quality equipment market.
- UPS systems are the most universally deployed power quality protection device, required in data centers, hospitals, industrial control rooms, telecom networks, and commercial IT infrastructure wherever continuous power availability is critical.
- The combination of enormous data center investment and the broad requirement for UPS across virtually every sensitive electronic application makes this the dominant equipment category by a significant margin.
- However, the SVC and STATCOM segment is projected to register the highest CAGR during the forecast period.
- Reactive power compensation equipment is seeing accelerating demand from utilities managing growing renewable energy penetration, and the progressive deployment of STATCOMs, which offer faster and more flexible reactive power control than traditional SVCs, is driving technology upgrade procurement in transmission and distribution networks globally.
- The utility grid stabilization application is generating large individual project values that are growing the segment's revenue rapidly from its current smaller base.
By Disturbance Type
- Voltage Sag and Swell to Hold the Largest Share
- The voltage sag and swell segment is expected to account for the largest share of the global power quality equipment market.
- Voltage sags, which are brief reductions in supply voltage below nominal levels, are the most common power quality problem experienced by industrial and commercial facilities and are the primary cause of production stoppages and equipment damage in manufacturing environments.
- The very broad range of equipment categories that address voltage sag, from UPS systems to voltage regulators and dynamic voltage restorers, means this disturbance type commands the largest associated equipment procurement volume.
- However, the harmonics segment is projected to register the highest CAGR during the forecast period.
- The proliferation of variable frequency drives, switching power supplies, LED lighting, and inverter-based renewable energy systems is introducing growing levels of harmonic distortion into electrical networks.
- As harmonic levels rise, the risk of overheating in transformers and motors, interference with control systems, and tripping of sensitive protection relays increases, driving growing adoption of harmonic filtering solutions across industrial, commercial, and utility networks.
- Application Insights
- Data Centers to Hold the Largest Share
- The data centers segment is expected to account for the largest share of the global power quality equipment market.
- Data centers require the most comprehensive and highest-specification power quality protection of any application, combining very large UPS systems, precision power distribution, harmonic filtering, and continuous monitoring in facilities where even a momentary power interruption is operationally unacceptable.
- The extraordinary global expansion of cloud and AI data center infrastructure is making this the most commercially significant single application in the power quality equipment market.
- However, the utilities and power generation segment is projected to register the highest CAGR during the forecast period.
- The renewable energy integration challenge is creating a large and growing demand for reactive power compensation and grid stability equipment at the utility level that is growing faster than any other application category, driven by national decarbonization policies that are progressively increasing the proportion of intermittent renewable generation in every major electricity market.
By End-Use Industry
- IT and Telecommunications to Hold the Largest Share
- The IT and telecommunications segment is expected to account for the largest share of the global power quality equipment market.
- Data centers, network facilities, and telecom infrastructure all require the highest specification and largest volume of power quality equipment per facility of any industry vertical.
- The IT and telecom sector's combination of enormous individual facility scale, 24/7 availability requirements, and rapid capacity expansion is generating the highest total power quality equipment spend of any industry.
- However, the energy and utilities segment is projected to register the highest CAGR during the forecast period.
- The combination of grid modernization investment, renewable energy integration requirements, and the electrification of heat and transport that is loading distribution networks with new variable demand patterns is creating growing procurement of reactive compensation, harmonic filtering, and voltage stabilization equipment at both the transmission and distribution utility levels.
Geographic analysis
Asia-Pacific
Largest shareIn 2026, Asia-Pacific is expected to account for the largest share of the global power quality equipment market. The region dominates because it contains the world's largest industrial economies outside North America, the fastest-growing data center markets, and very large utility grid investment programs in China, India, Japan, and Southeast Asia. China is both the world's largest manufacturer and a major buyer of power quality equipment, with its massive industrial base, rapidly expanding renewable energy grid, and growing data center sector generating very large procurement of UPS, harmonic filters, and reactive compensation equipment. India's industrial modernization, rapid expansion of data center infrastructure serving its growing IT sector and digital economy, and large government programs for grid reliability improvement are making it one of the fastest-growing power quality equipment markets in the region. Japan and South Korea are technologically sophisticated markets with high per-facility power quality requirements in their advanced manufacturing and semiconductor industries. The region's dominance reflects both the scale of its industrial and digital infrastructure and the ongoing investment in electrical grid modernization across multiple large national markets simultaneously.
Middle East & Africa
Fastest growthHowever, the Middle East and Africa region is expected to grow at the fastest CAGR during the forecast period. The Gulf states, particularly Saudi Arabia and the UAE, are investing at extraordinary scale in new industrial, commercial, and digital infrastructure under Vision 2030 and similar national transformation programs. The rapid construction of hyperscale and colocation data centers in the UAE to serve the region's growing cloud computing demand is generating very large concentrated UPS and power conditioning procurement. Saudi Arabia's massive industrial diversification programs including NEOM, the Red Sea Project, and industrial city expansions require extensive power quality infrastructure. Meanwhile, Sub-Saharan African markets are investing in more reliable electricity supply to support economic development, with power quality equipment demand growing alongside electrification programs. The combination of very large infrastructure investment programs and lower current penetration of power quality equipment creates the conditions for above-average growth through the forecast period.
North America
North America is a large and highly sophisticated power quality equipment market, driven primarily by the United States with its enormous data center sector that includes the hyperscale campuses of Amazon, Microsoft, and Google as well as a very large enterprise and colocation data center market. The U.S. industrial manufacturing sector, which operates complex automated facilities with stringent power quality requirements, and the healthcare sector with its critical power needs are additional major demand drivers. North America benefits from well-established energy efficiency standards and grid reliability regulations that create compliance-driven procurement of power quality equipment.
Europe
Europe is a market shaped by strong renewable energy integration requirements, particularly in Germany and Spain which have very high proportions of wind and solar generation, combined with advanced industrial and commercial power quality standards and a sophisticated grid modernization investment program under the EU's clean energy transition policies.
Competitive landscape
- Schneider Electric SE · France
- ABB Ltd. · Switzerland
- Siemens AG · Germany
- Eaton Corporation plc · Ireland
- Vertiv Holdings Co. (U.S.)
- General Electric Company (U.S.)
- Mitsubishi Electric Corporation · Japan
- Legrand SA · France
- Fuji Electric Co. Ltd. · Japan
- Delta Electronics Inc. · Taiwan
- Toshiba Corporation · Japan
- Socomec Group · France
- AEG Power Solutions · Germany
- Tripp Lite/Eaton (U.S.)
- Riello Elettronica Group · Italy
Frequently asked questions
The global power quality equipment market is expected to reach USD 62.8 billion by 2036 from an estimated USD 38.4 billion in 2026, at a CAGR of 5.1% during the forecast period 2026-2036.
Cite this report
Meticulous Research. (2026). Power Quality Equipment Market - Global Opportunity Analysis And Industry Forecasts (2026-2036) (Report No. MREP - 1041942). Meticulous Market Research Pvt. Ltd. https://www.meticulousresearch.com/product/power-quality-equipment-market-6625