Commercial & Industrial Energy Storage Market (2026-2036)
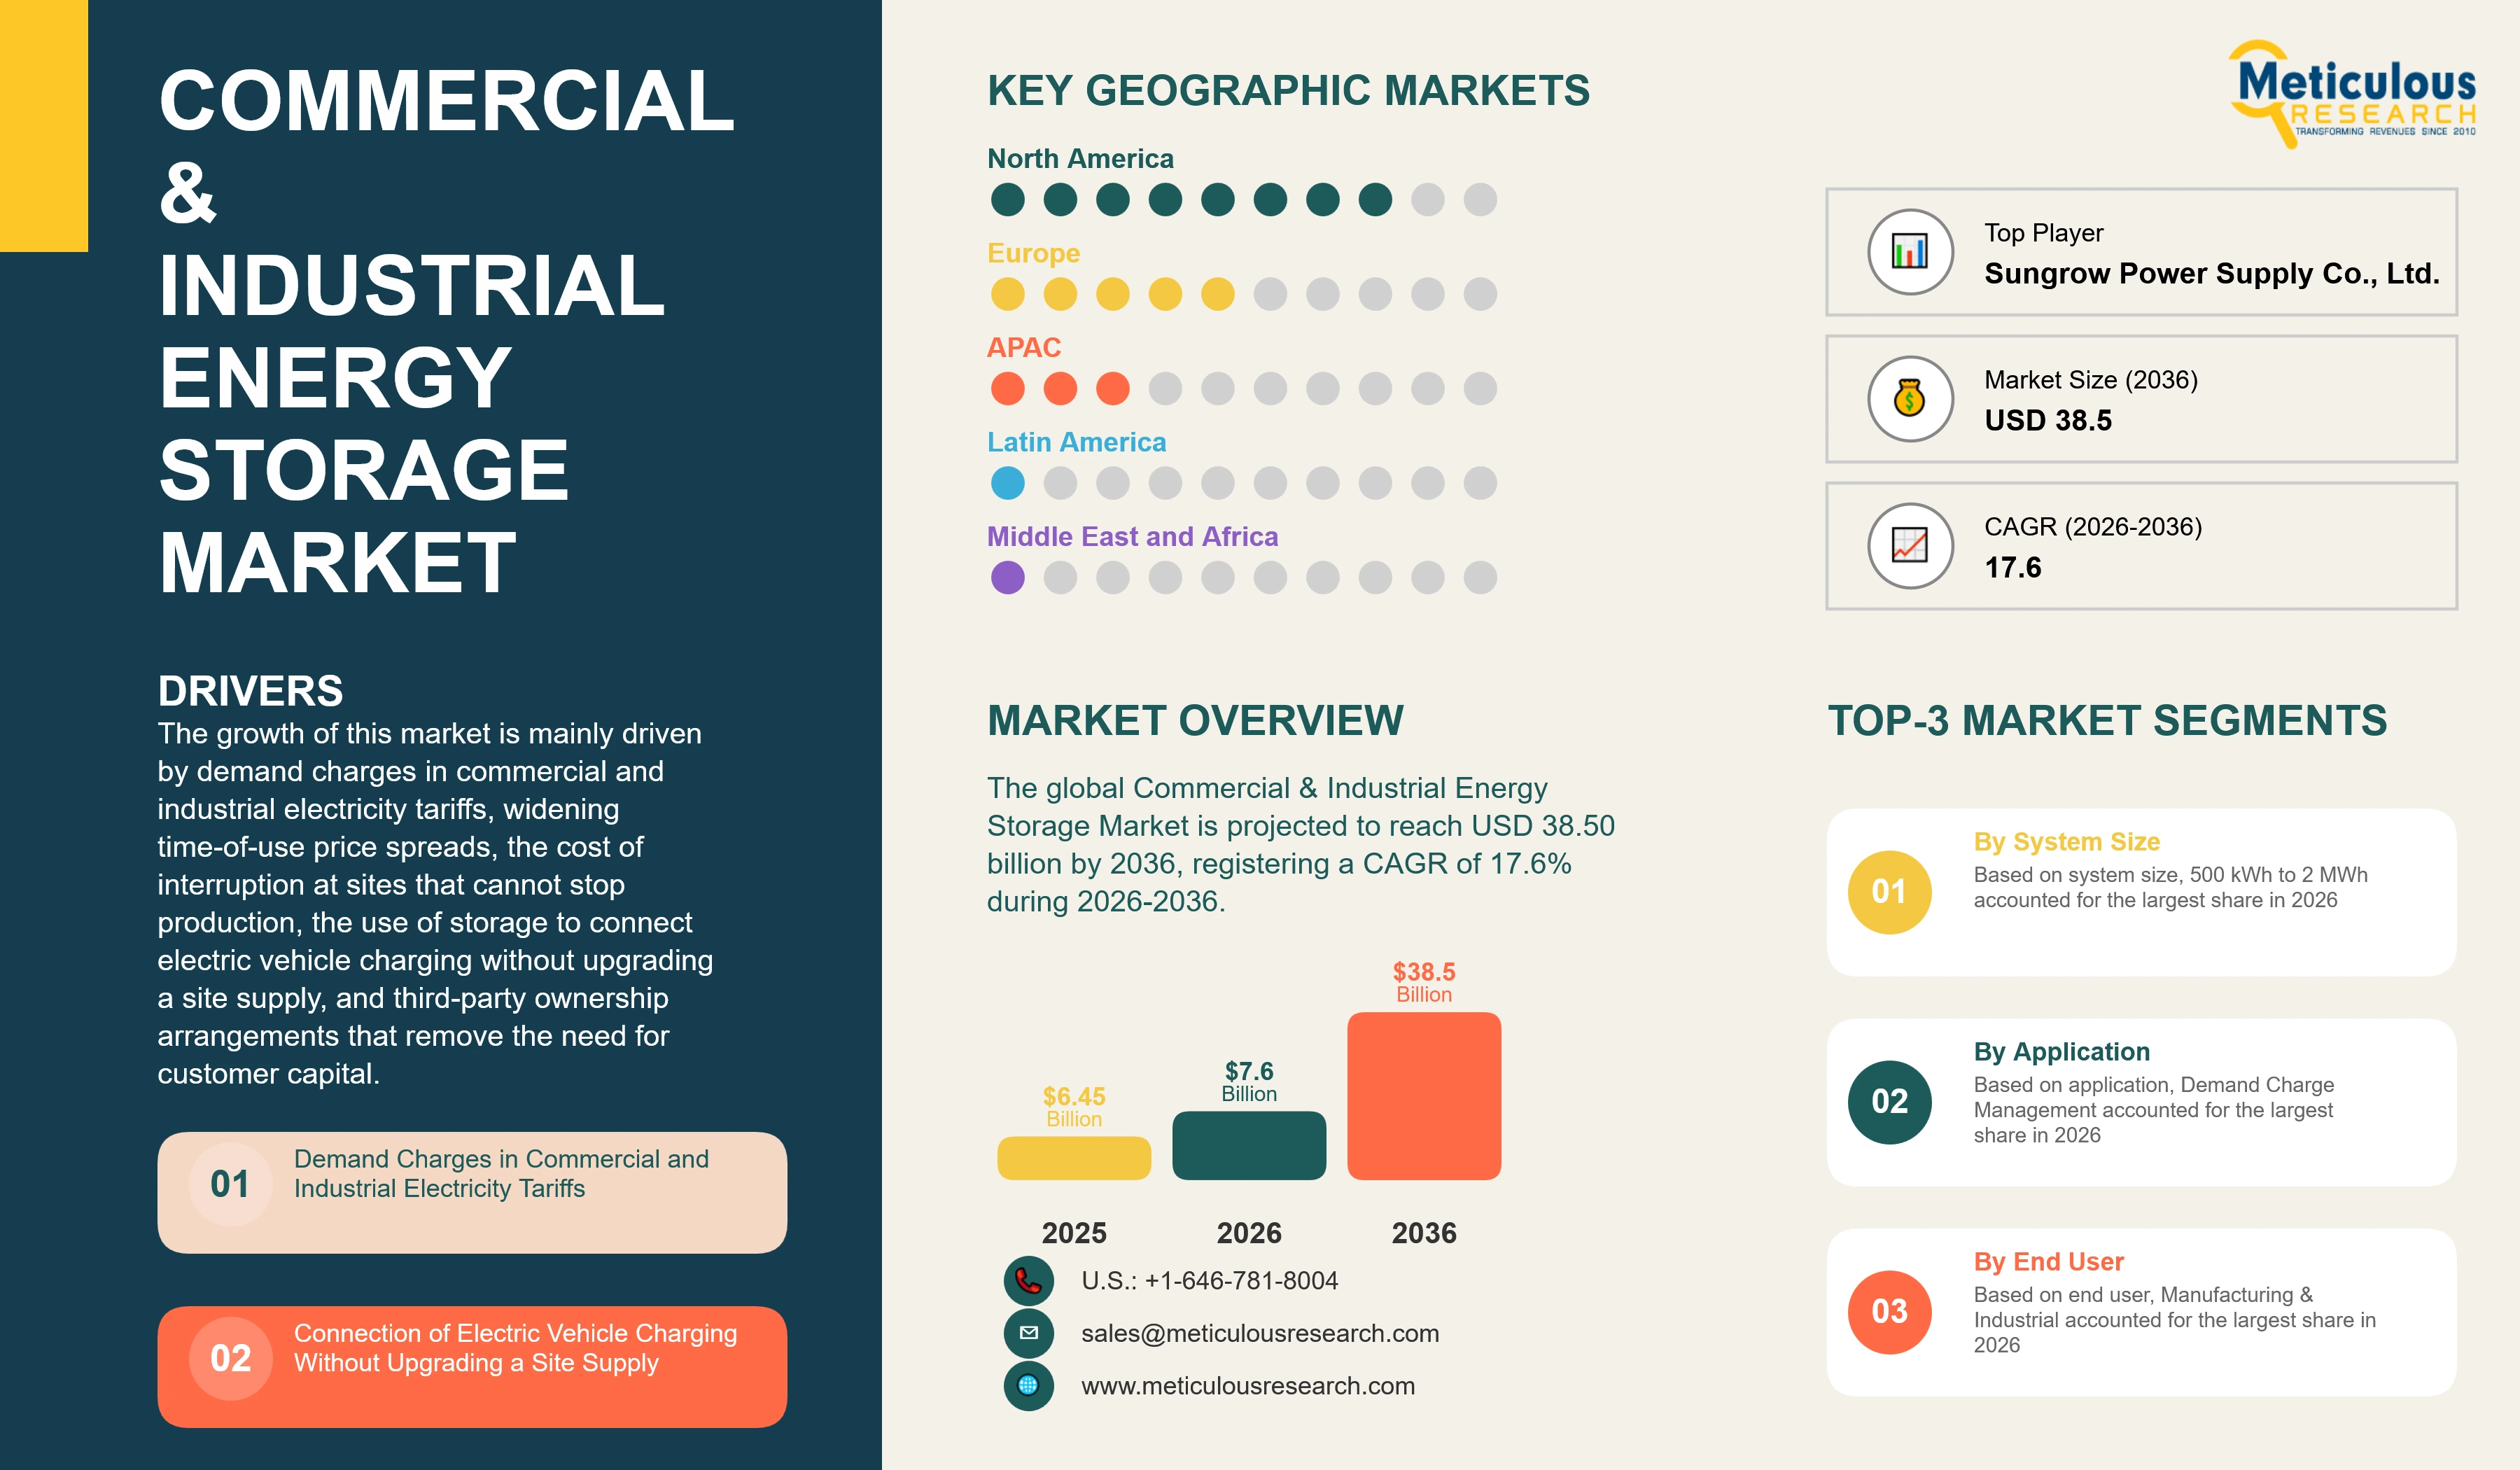
The global Commercial & Industrial Energy Storage Market was valued at USD 6.45 billion in 2025. This market is expected to reach USD 38.50 billion by 2036 from an estimated USD 7.60 billion in 2026, registering a CAGR of 17.6% during the forecast period (2026-2036).
- Published
- Oct 2026
- Pages
- 356
- Format
- PDF + Excel
- Report ID
- MREP - 1042413
- Base year
- 2025
- 2025 · BASELINE
- $6.45B
- 2036
- $38.50B
- CAGR 2026–2036
- 17.6%
2025 baseline · 2026–2036 forecast at 17.6% CAGR · hover a bar for the value
Key highlights
The global Commercial & Industrial Energy Storage Market is valued at USD 7.60 billion in 2026 and is projected to reach USD 38.50 billion by 2036, at a CAGR of 17.6%.
Based on application, the demand charge management segment is expected to account for the largest share of the market in 2026, while the electric vehicle charging support segment is projected to register the highest CAGR during the forecast period.
Based on system size, the 500 kWh to 2 MWh segment is expected to account for the largest share of the market in 2026, while the above 2 MWh segment is projected to register the highest CAGR during the forecast period.
Based on battery chemistry, the lithium iron phosphate segment is expected to account for the largest share of the market in 2026, while the sodium-ion segment is projected to register the highest CAGR during the forecast period.
Based on ownership model, the customer-owned segment is expected to account for the largest share of the market in 2026, while the third-party-owned segment is projected to register the highest CAGR during the forecast period.
Based on end user, the manufacturing and industrial segment is expected to account for the largest share of the market in 2026, while the data centres and telecommunications segment is projected to register the highest CAGR during the forecast period.
Based on geography, Asia-Pacific is expected to account for the largest share of the market in 2026, while North America is projected to register the highest CAGR during the forecast period.
Report summary
| Particulars | Details |
|---|---|
| Base Year | 2025 |
| Estimated Year | 2026 |
| Forecast Period | 2026-2036 |
| Market Size in 2025 | USD 6.45 billion |
| Market Size in 2026 | USD 7.60 billion |
| Market Size by 2036 | USD 38.50 billion |
| CAGR (2026-2036) | 17.6% |
| Format | PDF, Excel & Cloud Portal · 356 pages |
| Largest Segment by Application (2026) | Demand Charge Management |
| Fastest-growing Segment by Application | Electric Vehicle Charging Support |
| Largest Segment by System Size (2026) | 500 kWh to 2 MWh |
| Largest Segment by Chemistry (2026) | Lithium Iron Phosphate |
| Fastest-growing Segment by Ownership Model | Third-Party-Owned |
| Largest Region (2026) | Asia-Pacific |
| Fastest-growing Region | North America |
| Segments Covered | Application, System Size, Battery Chemistry, Ownership Model, End User, Geography |
| Company Naming Basis | Registered legal entity, with group capability attributed to its owner |
| Number of Companies Profiled | 20, plus other companies |
Report overview
Segments covered: application, system size, chemistry, ownership model, end user.
The commercial and industrial energy storage market covers battery storage systems installed behind the meter at commercial and industrial sites, together with the power conversion, control software and services supplied with them, across systems from below 100 kWh to above 2 MWh and the demand charge management, energy arbitrage, backup power, solar self-consumption, grid service and electric vehicle charging applications they serve. The growth of this market is driven by demand charges in commercial electricity tariffs, by widening time-of-use price spreads, by the cost of outages at sites that cannot interrupt production, and by the use of storage to connect electric vehicle charging without upgrading a site supply.
Revenue in this market comes from avoided cost on an electricity bill rather than from a market price. A commercial or industrial system earns its return by reducing the peak demand a site records, by shifting consumption from expensive to cheaper hours, or by avoiding the loss caused by an interruption, so the value of a system depends on the tariff the site is billed under. The addressable market is therefore defined by tariff design rather than by electricity consumption, and it is concentrated in the regions and utility territories where demand charges are high.
Two United States requirements now apply to projects in this market at the same time. Imported cells carry a 25% tariff from 2026, and a project claiming the investment tax credit must demonstrate that a rising share of its content comes from outside prohibited foreign entities. Both raise the cost of a system and the documentation needed to support it, and the documentation effort does not fall with project size.
A commercial and industrial storage system is installed behind the meter at a site that consumes electricity rather than at a point on the network. It is sized to the load of the site and to the tariff the site is billed under, and it is operated to reduce a cost rather than to sell into a market. These systems typically range from a cabinet of around 100 kWh serving a retail unit to containerised installations of several megawatt hours at a factory, and the control software that decides when to charge and discharge carries as much of the value as the battery.
Demand charges are the largest single source of value and the least understood part of the business. A commercial electricity bill in many territories contains a charge based on the highest level of demand recorded in the billing period, often measured over fifteen or thirty minutes, and that charge can account for a substantial part of the total bill at a site with an uneven load. A storage system that discharges during those few intervals reduces the recorded peak and therefore the charge, and it does so without changing how much electricity the site consumes. The saving depends entirely on the tariff, so an identical system installed at two sites in different utility territories can produce very different returns.
Time-of-use spreads provide the second source of value and have widened as more solar generation has been added to networks. Where the price of electricity differs between hours, a system can charge when prices are low and discharge when they are high, and the value of doing so depends on the size of the spread rather than on the average price. Sites with solar generation gain an additional benefit, since storage allows generation produced at midday to be consumed in the evening instead of exported at a low price, which has become more valuable as export rates have been reduced in several markets.
Trade measures now raise the cost of the equipment. Under the schedule set out in the United States Trade Representative four-year review of Section 301 duties, lithium-ion non-electric vehicle batteries carry a 25% rate applying from 2026, as do natural graphite and permanent magnets. Lithium-ion electric vehicle batteries carry the same rate applying from 2024.
The rate on lithium-ion non-electric vehicle batteries applies directly to this market, because the cells used in commercial and industrial systems fall into that category rather than into the electric vehicle category. Most of those cells are lithium iron phosphate produced in China, so the tariff raises the delivered cost of the largest component in a system from 2026, and the increase is passed into project capital cost at a point where the return is calculated against a bill saving that has not changed.
A second United States requirement applies at the same time and is more demanding to satisfy. Under the One Big Beautiful Bill Act, the material assistance restriction applies to energy storage technology that begins construction after 31 December 2025, and the specified foreign entity and foreign-influenced entity restrictions take effect for the taxable year beginning in 2026. A project must meet a material assistance cost ratio, measured against the cost of manufactured products incorporated into the storage system, with the cost of products mined, produced or manufactured by a prohibited entity subtracted from the numerator. The required share of content from outside prohibited entities rises by the calendar year in which construction starts, at 55% in 2026, 60% in 2027, 65% in 2028, 70% in 2029 and 75% in 2030 and in each year after. Treasury must issue safe harbour tables by 31 December 2026, and until those tables are issued taxpayers may use the tables in Internal Revenue Service Notice 2025-08 for construction beginning on or before 60 days after the new tables appear.
The effect on this market is distinct from the effect on utility-scale storage. A project must now establish where the manufactured products in its system were made, calculate a cost ratio and retain the evidence, and the work involved in doing so is broadly the same whether the system is 500 kWh or 500 MWh. A commercial and industrial project therefore carries a documentation cost that is large relative to its total capital cost, and the smallest systems carry it most heavily. Developers are responding by standardising equipment across projects so that one supply chain assessment serves many installations, which favours suppliers able to provide consistent documentation across a product line.
The rising content requirement also changes procurement over the forecast period rather than at a single point. A project beginning construction in 2026 must show 55% of content from outside prohibited entities, while one beginning in 2030 must show 75%, so a developer planning a pipeline is buying against a moving requirement and needs supply arrangements that improve over time. This favours cells and components produced outside China and gives suppliers with capacity in North America and Europe a position that the tariff alone would not create.
Ownership models matter more in this market than in utility-scale storage because the customer is a business rather than an energy company. A site owner that uses capital for its own operations is frequently unwilling to spend it on an energy asset, so third-party ownership arrangements in which a developer installs and operates the system and shares the saving have become an established route to market. These arrangements also place the tariff analysis and the operating risk with the party best able to assess them, and they are growing faster than direct purchase as a result.
Chemistry has consolidated on lithium iron phosphate for the same reasons as in utility-scale storage, namely cycle life and the absence of nickel and cobalt, with the added consideration that a system installed inside or beside an occupied building is assessed for fire safety by the site insurer and the local authority. Sodium-ion is growing from a small base and suits this market better than it suits vehicles, since weight and volume matter less at a fixed installation and the chemistry avoids lithium supply exposure, while flow batteries remain confined to the small number of sites requiring very long discharge duration.
Two conditions qualify the growth rate in this market. The value of a system depends on a tariff, and a utility that restructures its demand charges or narrows its time-of-use spreads can reduce the return on an installed asset without any change in the equipment or its operation. The second is that the content requirements and tariffs described here are applied by governments and can be changed by them, and the forecast assumes the schedule set out above holds through the period.
Report infographic
Market dynamics
21 factors across 5 forcesDemand Charges in Commercial and Industrial Electricity Tariffs
Demand charges are a major factor driving the commercial and industrial energy storage market. A commercial bill in many territories includes a charge based on the highest demand recorded in the billing period, measured over fifteen or thirty minutes, and that charge can form a substantial part of the total bill at a site with an uneven load. A system that discharges during those intervals reduces the recorded peak without changing total consumption, which produces a saving that can be calculated from historical interval data before the system is bought. The driver is specific rather than general, since the saving depends on the tariff and an identical system can produce very different returns in different utility territories. The strength of the driver can therefore be read from tariff schedules rather than estimated, which is why installations concentrate in an identifiable set of utility territories rather than spreading evenly with electricity consumption.
Widening Time-of-Use Price Spreads
Price spreads between hours are driving demand as more solar generation is added to networks. A storage system charges when prices are low and discharges when they are high, and the value of doing so depends on the size of the spread rather than on the average price of electricity, so the driver strengthens as midday generation pushes daytime prices down and evening prices up. Sites with their own solar generation gain further, since storage allows midday output to be consumed in the evening rather than exported, and the driver has strengthened in markets where export rates have been reduced. A site with solar generation and no storage exports surplus output at a rate that has fallen in several markets, while the same output consumed on site displaces electricity bought at the full retail price, and the difference between those two values is what the system captures.
Cost of Interruption at Sites That Cannot Stop Production
Outage cost is driving demand at sites where an interruption destroys work in progress or stops a process that is expensive to restart. A storage system provides immediate transfer without the start time of a generator and operates without fuel storage, emissions consent or noise limits, which allows it to be installed where a standby engine could not. The driver is strongest in manufacturing, food processing, healthcare and data handling, and it supports a purchase that a bill saving alone would not justify, because the value is the loss avoided rather than the cost reduced. The driver also brings a different purchasing process, since the expenditure is assessed against operational risk rather than against an energy budget, and it is frequently approved by the operations function rather than by the energy manager. Food processing, pharmaceutical manufacturing and continuous process plants place the highest value on this benefit. In those settings the value of a single avoided interruption can exceed the cost of the system, which shortens the payback calculation considerably.
Connection of Electric Vehicle Charging Without Upgrading a Site Supply
Charging infrastructure is driving the fastest-growing application in this market. Installing fast chargers at a commercial site frequently requires a larger supply connection, which is expensive and can take years to deliver, and a storage system placed between the connection and the chargers allows the site to supply short high-power charging sessions from the battery rather than from the grid. The driver avoids a capital cost and a delay rather than reducing a bill, which makes the business case clearer to a site owner than the tariff arithmetic, and it applies to retail, logistics and fleet depots where charging is being added to an existing connection. The driver is strengthening as fleet operators replace vehicles and require depot charging on existing sites, and as retail operators add charging to attract customers without the connection capacity that was never installed for that purpose.
Table of contents
13 chapters · 147 sections · 356 pages · click to expandGeographic analysis
Asia-Pacific
Largest shareIn 2026, Asia-Pacific is expected to account for the largest share of the market. The large share of this region is mainly due to industrial electricity tariffs with substantial demand components in several national markets, the concentration of manufacturing sites with the load profiles these systems suit, and the availability of locally manufactured cells and complete systems at the lowest installed cost in any region.
North America
Fastest growthHowever, North America is projected to register the highest CAGR during the forecast period. The rapid growth of this region is attributed to demand charges that form a large part of commercial bills in many utility territories, to the investment tax credit available to projects that satisfy the content requirements, and to electric vehicle charging being added at commercial sites with connections sized for an earlier purpose. Growth is tempered by the 25% tariff applying from 2026 to imported lithium-ion non-electric vehicle batteries and by the documentation now required to claim the credit.
Europe
Europe occupies a position shaped by energy price volatility and by network charges rather than by a single incentive. Industrial sites across the region have installed storage in response to price movement and to capacity-based network charges, and the regulation governing batteries placed on the European Union market requires suppliers to produce verified information on carbon footprint and material origin. Demand in the region is therefore weighted towards suppliers able to document their supply chains, and growth varies between countries according to how network charges are structured. Germany and Italy hold the largest national positions in the region, reflecting industrial electricity costs and the volume of commercial solar generation already installed at sites where storage adds self-consumption value. The United Kingdom and Spain follow, supported by capacity charges and by commercial solar additions respectively. Installation across the region is weighted towards existing commercial solar sites rather than towards new standalone storage.
Latin America
Latin America and the Middle East & Africa remain smaller positions where installations follow grid reliability rather than tariff arbitrage. Sites in both regions install storage to maintain operation through interruptions and to reduce diesel consumption, which values the system on the loss avoided rather than on a bill saving, and procurement is usually part of a wider electrical contract. Both regions are therefore best addressed through engineering contractors and system integrators rather than through direct supply.
Competitive landscape
The competitive landscape of the commercial and industrial energy storage market contains four groups of suppliers. Chinese system and inverter manufacturers supply complete systems at the lowest installed cost and hold most of the global volume. Electrical equipment groups supply storage alongside switchgear, power distribution and building systems, and reach customers through the contractors that already install their equipment. Storage developers and operators install and run systems under third-party ownership arrangements and earn from the saving rather than from the equipment. Cell manufacturers supply the batteries that the other three groups package.
Three things determine which suppliers win work in this market. The first is the ability to produce consistent content documentation across a product line, because the cost ratio must be evidenced for each project and the required share rises each year. The second is forecasting and dispatch software, since a system that discharges at the wrong interval delivers a fraction of the available saving and equipment alone does not produce the return. The third is an approval record for installation at occupied sites, because insurers and local authorities assess fire safety and separation before a site will accept a system.
Routes to market separate the groups more than product specification does. An electrical equipment group reaches a site through the contractor that maintains its switchgear, a Chinese manufacturer reaches it through a distributor or an integrator competing on installed price, and a developer reaches it directly with a saving-sharing proposal that requires no capital from the customer. The same site can therefore be approached by three suppliers making different offers, and the customer is comparing a purchase against a service rather than one product against another.
Key players operating in the global Commercial & Industrial Energy Storage Market are Sungrow Power Supply Co., Ltd. (China), BYD Company Limited (China), Contemporary Amperex Technology Co., Limited (China), Huawei Technologies Co., Ltd. (China), Tesla, Inc. (U.S.), Fluence Energy, Inc. (U.S.), Stem, Inc. (U.S.), SolarEdge Technologies, Inc. (Israel), Schneider Electric SE (France), Eaton Corporation plc (Ireland), Siemens AG (Germany), ABB Ltd (Switzerland), SMA Solar Technology AG (Germany), Delta Electronics, Inc. (Taiwan), AlphaESS Co., Ltd. (China), Pylon Technologies Co., Ltd. (China), Narada Power Source Co., Ltd. (China), LG Energy Solution, Ltd. (South Korea), Samsung SDI Co., Ltd. (South Korea), and Enphase Energy, Inc. (U.S.).
Companies are identified at registered legal entity level, and capability held within a group is attributed to the entity that owns it. The companies profiled were verified as active in the supply of commercial and industrial behind-the-meter storage systems, the power conversion and control software supplied with them, or the cells used in them as of October 2026. Suppliers of utility-scale storage without a commercial and industrial product, residential storage suppliers without a commercial product, uninterruptible power supply manufacturers without a storage product sized for tariff management, electrical contractors and installers without proprietary products, and software suppliers without a storage offering were excluded.
- Sungrow Power Supply Co., Ltd. · China
- BYD Company Limited · China
- Contemporary Amperex Technology Co., Limited · China
- Huawei Technologies Co., Ltd. · China
- Tesla, Inc. (U.S.)
- Fluence Energy, Inc. (U.S.)
- Stem, Inc. (U.S.)
- SolarEdge Technologies, Inc. · Israel
- Schneider Electric SE · France
- Eaton Corporation plc · Ireland
- Siemens AG · Germany
- ABB Ltd · Switzerland
- SMA Solar Technology AG · Germany
- Delta Electronics, Inc. · Taiwan
- AlphaESS Co., Ltd. · China
- Pylon Technologies Co., Ltd. · China
- Narada Power Source Co., Ltd. · China
- LG Energy Solution, Ltd. · South Korea
- Samsung SDI Co., Ltd. · South Korea
- Enphase Energy, Inc. (U.S.)
Expert perspectives
The commercial and industrial energy storage market is usually assessed alongside utility-scale storage, and the two earn their returns in different ways. A utility-scale asset sells into a market at a price, while a commercial or industrial system reduces a cost on an electricity bill, so the value of a system here depends on the tariff a site is billed under and on the shape of its load rather than on a wholesale price. Two United States requirements now apply to these projects at once. Lithium-ion non-electric vehicle batteries carry a 25% rate applying from 2026 under the Section 301 schedule, and under the One Big Beautiful Bill Act a project beginning construction after 31 December 2025 must satisfy a material assistance cost ratio, with the required share of content from outside prohibited entities at 55% in 2026 rising to 75% from 2030. The binding constraint is therefore shifting from the cost of the equipment to the tariff that determines the saving and the documentation required to claim the credit.
Three features are expected to shape competitive positions through 2036. First, content documentation will continue to favour larger systems and standardised products, because the cost ratio must be calculated and evidenced for each project and that work does not fall with project size. Second, value will continue moving from the battery towards the software that operates it, since a system that discharges at the wrong interval delivers a fraction of the available saving. Third, third-party ownership will continue growing faster than direct purchase, because commercial and industrial site owners prefer to spend capital on their own operations and these arrangements place the tariff analysis and operating risk with the developer.
For companies planning entry or expansion, storage paired with electric vehicle charging is the clearest opportunity, because the case rests on avoiding a connection upgrade with its cost and waiting period rather than on tariff arithmetic a site owner must be persuaded to accept. Standardised products with consistent content documentation are worth more to a developer than a lower equipment price, since the documentation cost recurs at every project while the equipment saving does not. Buyers should establish what share of content a supplier is able to evidence from outside prohibited entities, and should check that figure against the year in which construction will begin rather than against the current requirement.
Two cautions belong in any assessment of this market. The first concerns the source of the return. The saving depends on a tariff, and a utility that restructures demand charges, lengthens the measurement interval or narrows time-of-use spreads reduces the return on an asset that remains in place for a decade or more, which is why a lender assessing these projects has no contractual revenue to rely on. The second concerns the documentation requirement. The cost ratio applies to projects beginning construction after 31 December 2025 and the required share rises each year, so a developer is buying against a moving target and a supply arrangement adequate in 2026 will not be adequate in 2030. A pipeline assembled on current arrangements should therefore be tested against the requirement applying in the year each project is expected to begin construction. A delay in starting construction can move a project into a higher requirement without any change in its design.
Overall, the core of demand through the forecast period will continue to sit in lithium iron phosphate systems of 500 kWh to 2 MWh purchased by manufacturing and industrial sites for demand charge management across Asia-Pacific, while the fastest growth will come from electric vehicle charging support, systems above 2 MWh, sodium-ion chemistry, third-party ownership, data centre and telecommunications buyers and North American installations.
Customer perspectives
Energy Manager, Multi-Site Food Manufacturer
This perspective confirms that the return on a system depends on the tariff a site is billed under and on the shape of its load rather than on the equipment installed. It supports the conclusion that the addressable market is defined by tariff design rather than by electricity consumption, and that a proposal requires site-specific interval analysis before a price can be offered.
Head of Property, Logistics and Distribution Group
This perspective identifies the avoidance of a connection upgrade as a clearer business case than tariff reduction. It supports the conclusion that electric vehicle charging support is the fastest-growing application in this market and that it brings buyers whose reason for purchase is a capital cost avoided rather than a bill reduced.
Development Director, Commercial Storage Developer
This perspective confirms that content documentation costs do not fall with project size and that developers are standardising equipment in response. It supports the conclusion that consistent documentation across a product line is worth more to a developer than a lower equipment price and that the requirement concentrates purchasing on fewer suppliers.
Frequently asked questions
The market was valued at USD 6.45 billion in 2025 and is estimated at USD 7.60 billion in 2026.
Cite this report
Meticulous Research. (2026). Commercial & Industrial Energy Storage Market - Global Opportunity Analysis and Industry Forecasts (2026-2036) (Report No. MREP - 1042413). Meticulous Market Research Pvt. Ltd. https://www.meticulousresearch.com/product/commercial-industrial-energy-storage-market-7096