Resources
About Us
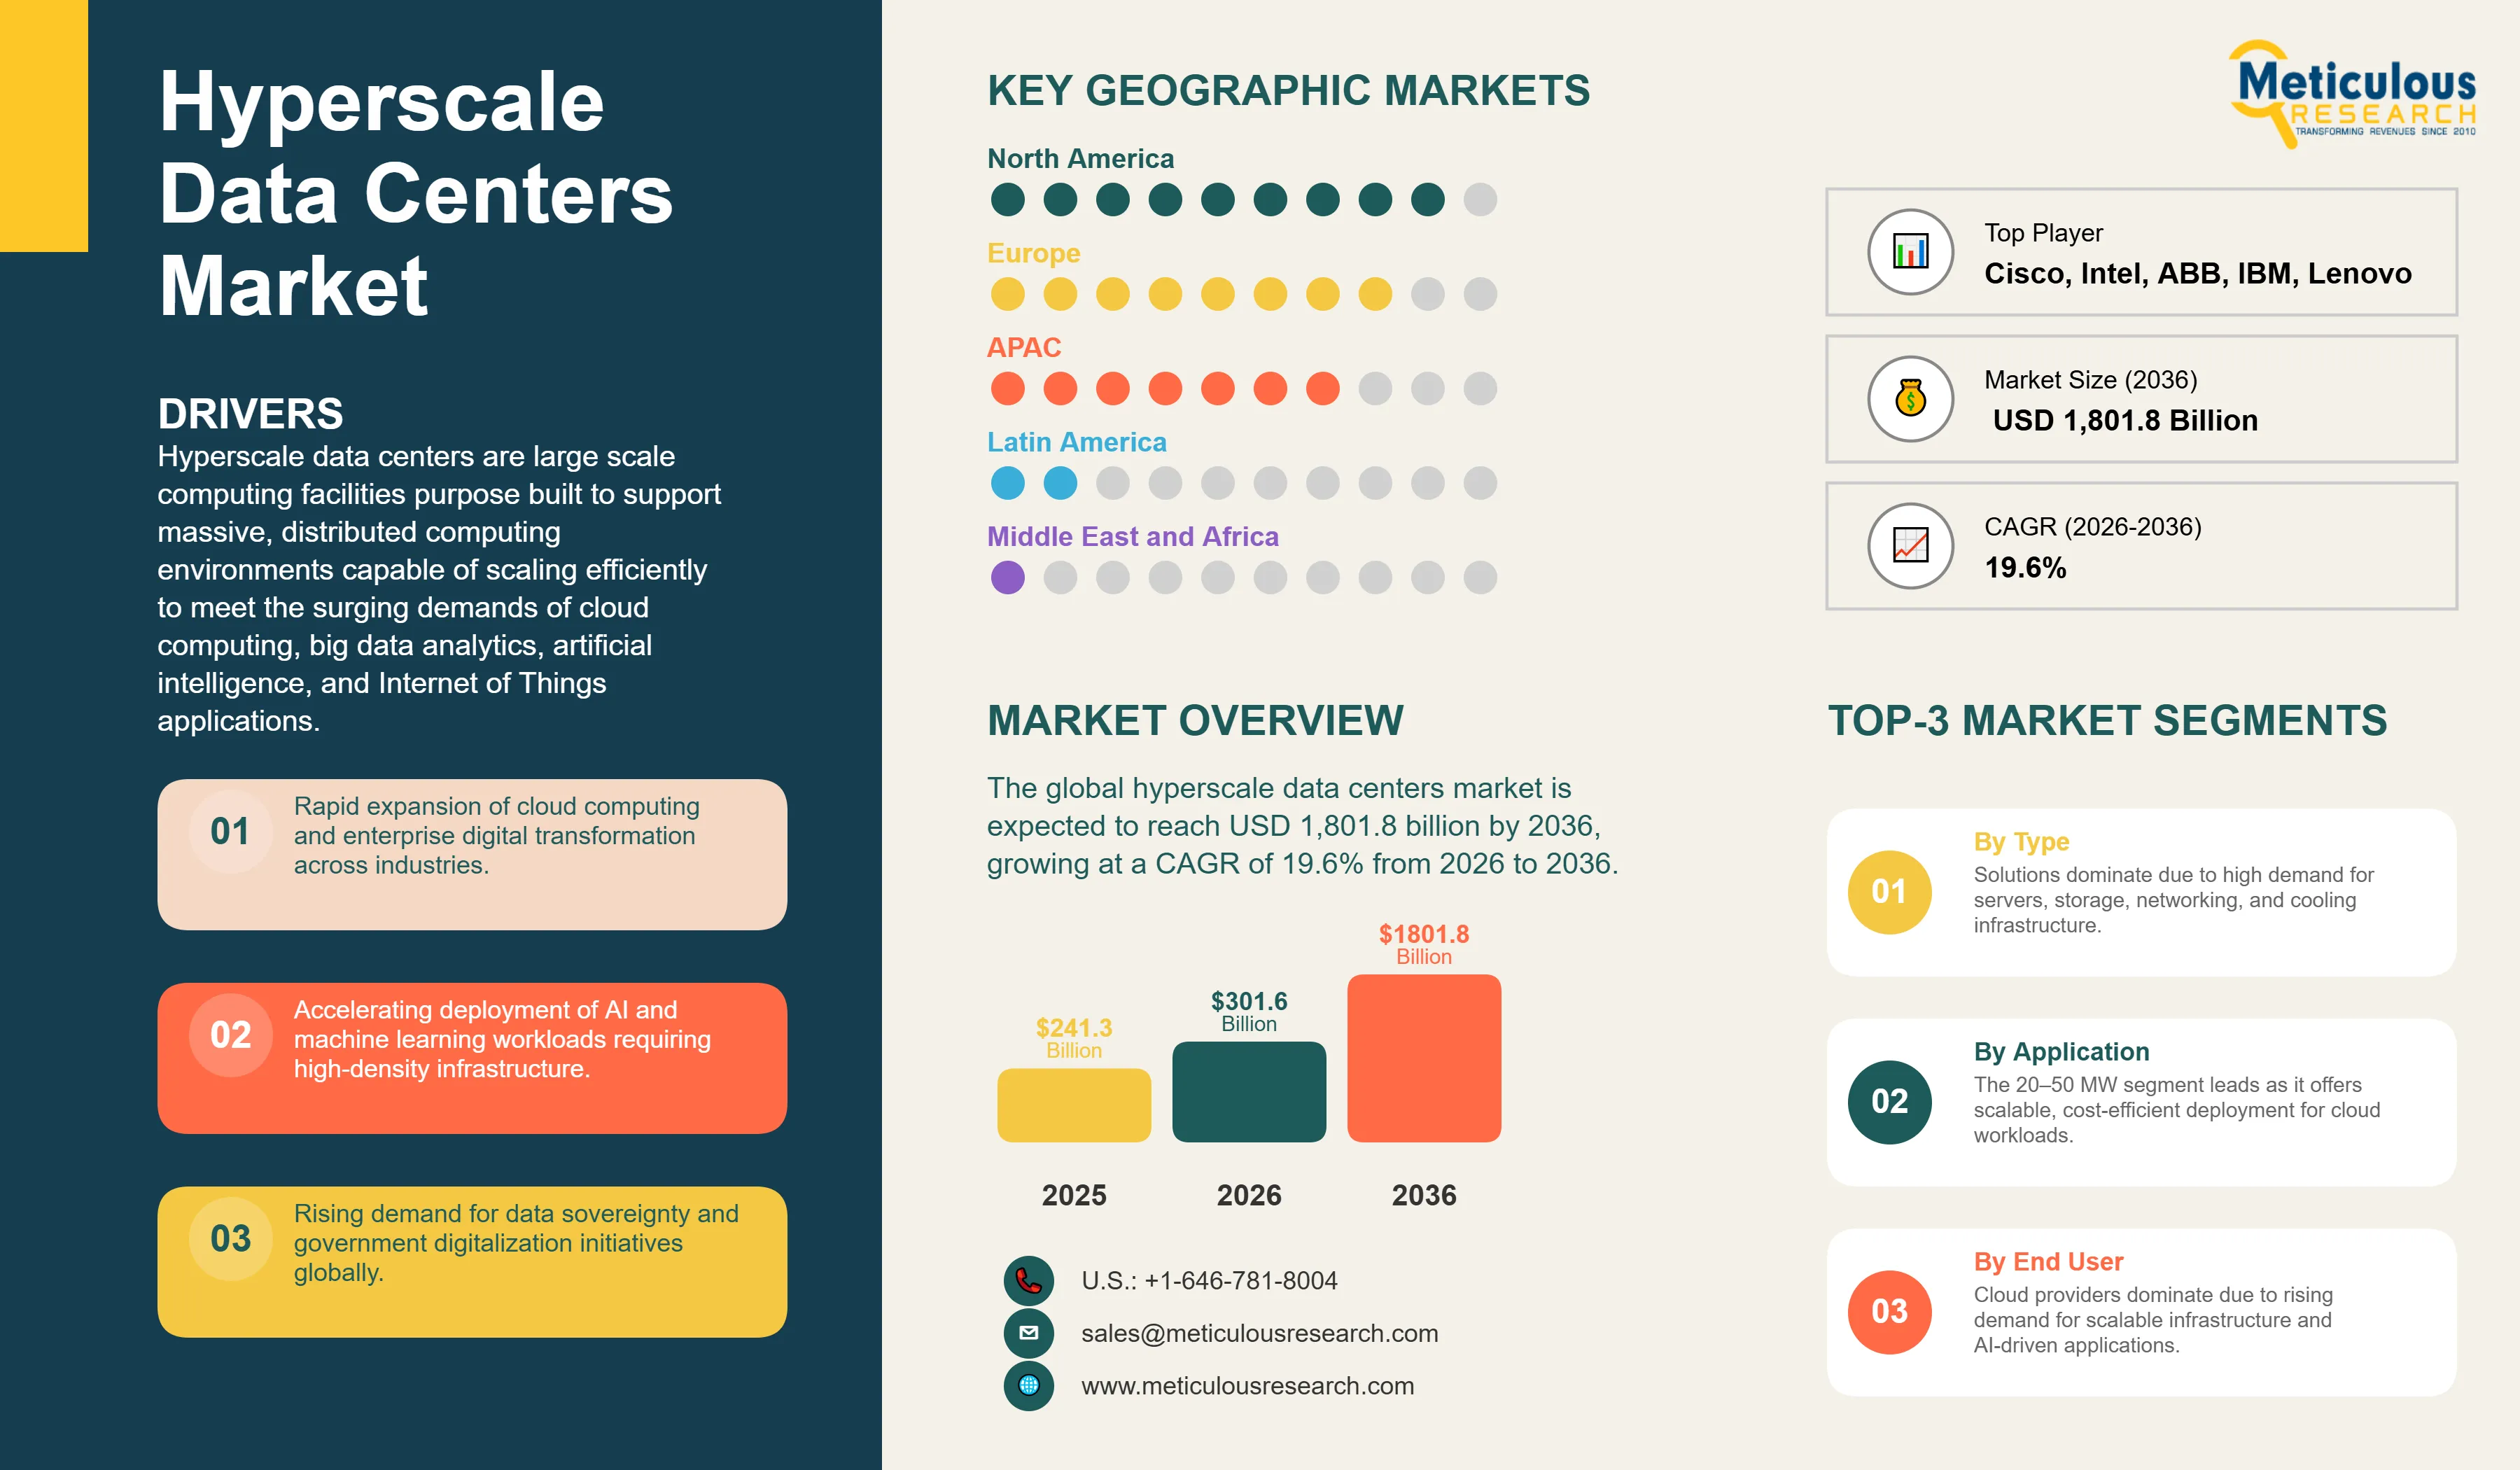
The global hyperscale data centers market was valued at USD 241.3 billion in 2025. This market is expected to reach USD 1,801.8 billion by 2036 from USD 301.6 billion in 2026, growing at a CAGR of 19.6% from 2026 to 2036.
Hyperscale data centers are large-scale computing facilities purpose-built to support massive, distributed computing environments capable of scaling efficiently to meet the growing demands of cloud computing, big data analytics, artificial intelligence, and Internet of Things applications. These facilities are distinguished by their ability to scale horizontally across vast floor spaces often exceeding 10,000 square feet and housing 5,000 or more servers while rigorously optimizing power usage effectiveness, cooling efficiency, and operational costs. Architecturally, hyperscale facilities leverage advanced technologies including software-defined networking, virtualization, containerization, edge computing integration, and automated infrastructure management to deliver the high performance, reliability, and flexibility that major cloud providers, social media platforms, e-commerce giants, and large enterprises require.
Key factors driving the growth of the overall hyperscale data center market include the rapid expansion of cloud computing and enterprise digital transformation, the increasing deployment of artificial intelligence and machine learning workloads, growing government mandates around data sovereignty, and the global rollout of 5G infrastructure. The number of large data centers operated by hyperscale providers increased to 1,297 worldwide as of the third quarter of 2025, nearly tripling since early 2018, while global public cloud spending reached approximately USD 679 billion in 2024, reflecting the reliance of enterprises on cloud-native, multi-cloud, and hybrid architectures. At the same time, AI training and inference workloads are reshaping facility design standards, pushing rack power densities to 40–100+ kW per rack compared with 5–15 kW for traditional CPU-based configurations, and driving both the pace and scale of hyperscale infrastructure investment.
Furthermore, the hyperscale data centers market is driven by various factors such as the large-scale AI infrastructure buildout, hyperscale expansion into emerging economies across Asia-Pacific, the Middle East, and Latin America, and the rapid commercialization of advanced liquid cooling and AI-driven operations management technologies. The collective capital expenditure of the top five hyperscalers, Amazon, Microsoft, Alphabet, Meta, and Oracle, is poised to exceed USD 600 billion in 2026, with around 75% directed toward AI-centric infrastructure, indicating strong investment levels that are expected to drive growth of the hyperscale data center market during the forecast period.
Click here to: Get Free Sample Pages of this Report
Rapid Expansion of Cloud Computing and Enterprise Digital Transformation
Increasing adoption of cloud computing remains the key driver of the growth of the hyperscale data center market. As enterprises across banking, telecommunications, healthcare, and manufacturing increasingly rely on cloud-native applications, multi-cloud strategies, and hybrid architectures, the need for large-scale, highly available, and geographically distributed infrastructure continues to grow.
Global public cloud spending reached around USD 679 billion in 2024 and is projected to reach nearly USD 723 billion in 2025, indicating a steady shift in enterprise IT spending toward cloud-based services. The three leading cloud providers, such as Amazon Web Services, Microsoft Azure, and Google Cloud, together account for about 58% of global hyperscale data center capacity and continue to expand their infrastructure to meet rising demand.
The enterprise segment is expected to dominate the hyperscale data center market. Organizations in regulated and capital-intensive industries are increasingly adopting hyperscale environments to modernize legacy systems, improve operational agility, and strengthen cybersecurity. Multi-cloud strategies are now standard among large enterprises, driving sustained demand for both colocation facilities and cloud provider infrastructure.
Accelerating Deployment of AI and Machine Learning Workloads
The rapid deployment of artificial intelligence (AI) and machine learning (ML) workloads is another factor driving the growth of the overall hyperscale data center market. The growing use of large language models, generative AI, deep learning, and high-performance computing is significantly increasing requirements for compute density, power capacity, and advanced cooling systems compared to traditional cloud workloads. This shift is reshaping data center design and accelerating investments in hyperscale data center infrastructure. Major strategic initiatives further drive this momentum. The Stargate Project, backed by OpenAI, Oracle, and SoftBank, deployed initial capacity at its Abilene, Texas site, in September 2025 and targets up to USD 500 billion in total investment across 10 GW of capacity over four years globally. Meanwhile, Microsoft has committed around USD 80 billion toward AI-enabled data center capacity in FY2025 alone.
According to the International Energy Agency, global electricity consumption from accelerated servers, primarily driven by AI workloads, is projected to grow at around 30% annually under the base case scenario. These workloads are expected to account for nearly half of the total increase in global data center electricity consumption through 2030.
Growing Demand for Data Sovereignty and Government Digitalization
Data sovereignty regulations have become another key driver of the growth of the hyperscale data center market. Governments across major markets, such as the European Union under GDPR, India through the Digital Personal Data Protection Act (2023), and China under the Data Security Law (2021), are increasingly requiring that citizen and public sector data be stored and processed within national or regional boundaries. Similar regulatory trends are emerging across Southeast Asia, the Middle East, and Latin America. As a result, global cloud providers are expanding into new national markets by building localized cloud regions, accelerating hyperscale deployment beyond traditional hubs such as North America and Western Europe.
At the same time, large-scale government digitalization initiatives are reinforcing demand for sovereign cloud infrastructure. In the GCC region, Saudi Arabia’s Vision 2030 and the UAE’s national AI strategy are driving significant investments in regional data center capacity by companies such as Microsoft, Google, and Oracle. In Europe, initiatives such as GAIA-X and various national cloud programs are driving the development of infrastructure aligned with regional data protection standards.
As data sovereignty requirements become more stringent and enforcement strengthens, demand for compliant, geographically distributed hyperscale infrastructure is expected to increase significantly over the forecast period.
Expansion of 5G Infrastructure and Edge Cloud Integration
The global rollout of 5G networks is enabling a new wave of latency-sensitive applications, such as autonomous vehicles, smart cities, industrial IoT, remote healthcare, and augmented reality. These use cases are driving demand for both edge infrastructure and centralized hyperscale data centers.
The number of connected IoT devices reached around 17 billion in 2024 and is expected to reach 29 billion by 2030, significantly increasing data generation and processing requirements. This increase in data is driving the need for large-scale storage, computing, and AI-based analytics, most of which are supported by hyperscale facilities.
AI models are typically trained in hyperscale data centers using aggregated data from IoT and 5G networks, and then deployed at the edge for real-time processing. This model indicates the importance of hyperscale infrastructure, even as edge computing continues to expand.
In addition, the growing adoption of private 5G networks across manufacturing, logistics, and industrial sectors is driving demand for colocation and hyperscale infrastructure capable of supporting mission-critical operations.
Expansion of Hyperscale Data Center Infrastructure in Emerging Economies
Emerging economies across Southeast Asia, India, the Gulf Cooperation Council (GCC), Sub-Saharan Africa, and Latin America provide the most significant geographic growth opportunity for hyperscale data center providers. These regions are witnessing rapid growth in digital services such as fintech, e-commerce, mobile healthcare, and government-led digitalization, driving strong demand for cloud and AI infrastructure.
In Southeast Asia, capacity constraints in Singapore, mainly related to power and land availability, are pushing hyperscale operators such as Amazon Web Services, Microsoft, Google, and ByteDance to expand into nearby markets. Johor, in southern Malaysia, has emerged as a key overflow hub supporting regional cloud and AI workloads.
In India, increasing adoption of enterprise cloud and initiatives such as Digital India are driving hyperscale investments in major data center hubs, such as Mumbai, Hyderabad, and Chennai. Similarly, in Latin America, Brazil and Mexico remain the leading markets, with ongoing capacity expansions in cities such as São Paulo, Mexico City, and Querétaro.
Overall, as digital adoption accelerates and local infrastructure gaps persist, these regions are expected to attract substantial hyperscale investments over the forecast period.
Liquid Cooling and Next-Generation Thermal Management Technologies
The shift from traditional air cooling to advanced liquid cooling is creating a major opportunity across data center equipment, engineering, and services markets. As AI workloads push rack power densities beyond 100 kW, liquid cooling is rapidly becoming essential for high-performance computing environments.
Technologies such as immersion cooling, where servers are submerged in non-conductive fluids, enable significantly higher rack densities while reducing water usage. These advanced cooling solutions can achieve power usage effectiveness (PUE) levels close to or below 1.1, compared to the global average of around 1.56, resulting in lower energy consumption, reduced operating costs, and improved sustainability.
At the same time, stringent regulatory frameworks, mainly in Europe under energy efficiency directives and in the U.S. through evolving environmental policies, are increasing the focus on energy efficiency and water conservation. As a result, next-generation thermal management is becoming critical not only for performance but also for regulatory compliance.
AI-Powered Data Center Operations and Infrastructure Management
The use of artificial intelligence in data center operations is a highly differentiated opportunity within the hyperscale market. AI-driven tools, such as intelligent power management, predictive maintenance, automated cooling systems, and real-time resource allocation, enable operators to reduce energy consumption, minimize downtime, and improve overall capacity utilization across large-scale facilities.
A notable example is Google DeepMind, which has deployed AI-based cooling optimization systems, achieving up to ~40% reduction in cooling energy consumption. Such advancements highlight the significant efficiency gains possible through AI integration.
As energy constraints, sustainability pressures, and infrastructure complexity continue to increase, AI-powered operations are expected to become a core component of hyperscale data center strategies and a key source of competitive advantage.
Hyperscale Data Centers Market Analysis: Top Market Segments
By Component: The Solutions Segment to Dominate the Hyperscale Data Centers Market in 2026
Based on component, the hyperscale data centers market is segmented into solutions and services. In 2026, the solutions segment is expected to account for the largest share, primarily due to the high capital investment required for core infrastructure. This includes IT hardware such as servers, storage, and networking equipment, along with facility infrastructure like power and cooling systems, as well as software platforms that enable data center operations.
The continued expansion of cloud infrastructure and the rapid adoption of AI-driven workloads are driving strong demand for high-performance servers, advanced cooling technologies, and scalable architectures. As a result, solutions spending is expected to remain the dominant revenue contributor throughout the forecast period.
However, the services segment is projected to register the fastest growth rate from 2026 to 2036. This growth is driven by the increasing complexity of hyperscale environments and the rising need for specialized capabilities in design, deployment, and operations. Demand for maintenance, support, and managed services is also increasing as operators expand across regions and adopt advanced technologies such as AI and liquid cooling.
By Power Capacity: The 20 MW–50 MW Segment to Dominate the Hyperscale Data Centers Market in 2026
Based on power capacity, the hyperscale data centers market is segmented into 20 MW–50 MW, 50 MW–100 MW, 100 MW–150 MW, and 150 MW and above. In 2026, the 20 MW–50 MW segment is expected to hold the largest market share, driven by its balance of scalability, cost efficiency, and deployment flexibility.
This capacity range is widely preferred by hyperscale operators as it supports phased expansion while allowing better control over power availability and capital investment. It also aligns well with current enterprise cloud and digital workload requirements, making it the most practical and widely adopted deployment size.
However, the 150 MW and above segment is projected to register the fastest CAGR during the forecast period. This growth is driven by rising demand for large-scale AI and high-performance computing workloads, which require significantly higher power capacity and dense infrastructure.
To support these needs, hyperscale operators are increasingly investing in mega-campus developments designed for GPU clusters, generative AI training, and large-scale data processing. Economies of scale and long-term capacity planning are further encouraging the development of ultra-large facilities.
By End User: The Cloud Providers Segment to Dominate the Hyperscale Data Centers Market in 2026
Based on end user, the hyperscale data centers market is segmented into cloud providers, colocation providers, technology providers, and enterprises. In 2026, the cloud providers segment is expected to account for the largest market share, driven by the continuous expansion of cloud infrastructure to meet rising demand for public, private, and hybrid cloud services.
Growing enterprise dependence on cloud platforms, increasing data volumes, and the need for scalable, on-demand computing resources are key factors supporting this dominance. In addition, the rapid deployment of AI and data-intensive applications on cloud platforms is further strengthening the position of cloud providers as the primary users of hyperscale infrastructure.
However, the colocation providers segment is expected to register the fastest CAGR from 2026 to 2036. Colocation enables faster market entry without significant upfront capital investment, making it an attractive option, mainly in emerging markets and for hybrid cloud strategies.
Hyperscale operators are also increasingly partnering with colocation providers to expand into new regions more quickly, further driving the growth of this segment.
North America Dominates the Hyperscale Data Centers Market in 2026
Based on geography, the global hyperscale data centers market is segmented into North America, Europe, Asia-Pacific, Latin America, and the Middle East & Africa. In 2026, North America is expected to account for the largest share of the global hyperscale data centers market. The growth of the hyperscale data center market in North America is mainly driven by the strong presence of leading hyperscale operators, high adoption of cloud computing, early deployment of AI and advanced digital technologies, and continuous investments in large-scale data center campuses, mainly across the U.S. The concentration of major technology companies and the ongoing expansion of AI-driven infrastructure further drive the growth of this market.
However, the Asia-Pacific region is expected to register the highest growth rate during the forecast period. The rapid growth of the hyperscale data center market in Asia-Pacific is driven by increasing internet penetration, rising cloud adoption, and strong government initiatives supporting digital transformation across China, India, and Southeast Asian nations. Growing demand for data localization, expansion of 5G networks, and increasing investments by global hyperscalers in emerging markets are further driving data center development across the region.
As digital economies continue to expand and enterprise cloud adoption deepens, Asia-Pacific is positioned to emerge as the fastest-growing market for hyperscale data centers over the forecast period.
Some of the prominent players operating in the global hyperscale data centers market include NVIDIA Corporation (U.S.), Cisco Systems, Inc. (U.S.), Intel Corporation (U.S.), Lenovo (China/U.S.), Eaton (Ireland), ABB Ltd. (Switzerland), Rittal GmbH & Co. KG (Germany), IBM Corporation (U.S.), Microsoft Corporation (U.S.), VMware, Inc. (U.S.), Nutanix, Inc. (U.S.), Dell Technologies Inc. (U.S.), Super Micro Computer/Supermicro (U.S.), Schneider Electric SE (France), Vertiv Holdings Co. (U.S.), Huawei Technologies Co., Ltd. (China), Hewlett Packard Enterprise (U.S.), Arista Networks, Inc. (U.S.), NTT DATA Corporation (Japan), Accenture plc (Ireland), and Kyndryl Holdings, Inc. (U.S.).
|
Particulars |
Details |
|
Forecast Period |
2026–2036 |
|
Base Year |
2025 |
|
CAGR (Value) |
19.6% |
|
Market Size (Value) in 2026 |
USD 301.6 Billion |
|
Market Size (Value) in 2036 |
USD 1,801.8 Billion |
|
Segments Covered |
By Component: Solutions, Services; By Power Capacity: 20 MW–50 MW, 50 MW–100 MW, 100 MW–150 MW, 150 MW and Above; By End User: Cloud Providers, Colocation Providers, Technology Providers, Enterprises |
|
Countries Covered |
North America (U.S., Canada), Europe (Germany, France, U.K., Italy, Spain, and Rest of Europe), Asia-Pacific (China, India, Japan, South Korea, Australia, and Rest of Asia-Pacific), Latin America (Brazil, Mexico, Argentina, and Rest of Latin America), and the Middle East & Africa (Saudi Arabia, South Africa, UAE) |
|
Key Companies |
NVIDIA Corporation (U.S.), Cisco Systems, Inc. (U.S.), Intel Corporation (U.S.), Lenovo (China/U.S.), Eaton (Ireland), ABB Ltd. (Switzerland), Rittal GmbH & Co. KG (Germany), IBM Corporation (U.S.), Microsoft Corporation (U.S.), VMware, Inc. (U.S.), Nutanix, Inc. (U.S.), Dell Technologies Inc. (U.S.), Super Micro Computer/Supermicro (U.S.), Schneider Electric SE (France), Vertiv Holdings Co. (U.S.), Huawei Technologies Co., Ltd. (China), Hewlett Packard Enterprise (U.S.), Arista Networks, Inc. (U.S.), NTT DATA Corporation (Japan), Accenture plc (Ireland), and Kyndryl Holdings, Inc. (U.S.) |
The global hyperscale data centers market is estimated at USD 301.6 billion in 2026.
The market is projected to grow from USD 301.6 billion in 2026 to USD 1,801.8 billion by 2036, at a CAGR of 19.6%.
The hyperscale data centers market analysis indicates strong and sustained growth momentum, with the market projected to reach USD 1,801.8 billion by 2036, at a CAGR of 19.6% from 2026 to 2036.
Key companies operating in this market include NVIDIA Corporation, Cisco Systems, Inc., Intel Corporation, Lenovo, Eaton, ABB Ltd., Rittal GmbH & Co. KG, IBM Corporation, Microsoft Corporation, Dell Technologies Inc., Schneider Electric SE, Vertiv Holdings Co., Huawei Technologies Co., Ltd., Hewlett Packard Enterprise, and Arista Networks, Inc., among others.
The accelerating deployment of generative AI and large language model workloads, the rapid adoption of advanced liquid and immersion cooling technologies, and the expansion of AI-powered data center infrastructure management platforms are among the most prominent trends shaping the hyperscale data centers market.
Which segments will hold large market shares in the hyperscale data centers market during 2026–2036?
By component, the solutions segment is forecasted to hold the largest share; by power capacity, the 20 MW–50 MW segment is expected to dominate; by end user, the cloud providers segment is expected to lead; and by geography, North America is expected to hold the largest market share during 2026–2036.
North America is expected to hold the largest share of the hyperscale data centers market in 2026, supported by the strong presence of leading hyperscale operators, high cloud adoption, and continuous large-scale data center campus investments. However, Asia-Pacific is expected to register the highest growth rate during the forecast period, driven by increasing internet penetration, rising cloud adoption, government-backed digital transformation programs, and accelerating investments by global hyperscalers in emerging markets.
Key drivers include the rapid expansion of cloud computing and enterprise digital transformation, the accelerating deployment of AI and machine learning workloads, growing demand for data sovereignty-compliant infrastructure, and the expansion of 5G networks and edge-cloud integration. These factors are collectively driving large-scale investment in hyperscale data center capacity across both established and emerging markets worldwide.
1. Introduction
1.1 Market Definition & Scope
1.2 Currency & Limitations
2. Research Methodology
2.1 Research Approach
2.2 Data Collection & Validation
2.2.1 Secondary Research
2.2.2 Primary Research
2.3 Market Assessment
2.3.1 Market Size Estimation
2.3.2 Bottom-Up Approach
2.3.3 Top-Down Approach
2.3.4 Growth Forecast
2.4 Assumptions for the Study
3. Executive Summary
4. Market Insights
4.1 Overview
4.2 Global Hyperscale Data Center Market: Impact Analysis of Market Drivers (2025–2036)
4.2.1 Rapid Expansion of Cloud Computing and Enterprise Digital Transformation
4.2.2 Accelerating Deployment of AI and Machine Learning Workloads
4.2.3 Growing Demand for Data Sovereignty and Government Digitalization
4.2.4 Expansion of 5G Infrastructure and Edge-Cloud Integration
4.3 Global Hyperscale Data Center Market: Impact Analysis of Market Restraints (2025–2036)
4.3.1 Power Grid Capacity Constraints and Energy Availability
4.3.2 High Capital Expenditure and Extended Development Lead Times
4.3.3 Water Consumption and Environmental Opposition
4.4 Global Hyperscale Data Center Market: Impact Analysis of Market Opportunities (2025–2036)
4.4.1 Hyperscale Expansion in Emerging Economies
4.4.2 Liquid Cooling and Next-Generation Thermal Management Technologies
4.4.3 AI-Powered Data Center Operations and Infrastructure Management
4.4.4 Waste Heat Recovery and District Energy Integration
4.5 Global Hyperscale Data Center Market: Impact Analysis of Market Challenges (2025–2036)
4.5.1 Balancing Rapid Capacity Expansion with Renewable Energy and Carbon Commitments
4.5.2 Cybersecurity Complexity and Data Sovereignty Compliance
4.5.3 Integration of Legacy Systems with Modern Hyperscale Infrastructure
4.6 Impact of AI and Sustainability on Hyperscale Data Centers
4.7 Regulatory Landscape and Green Building Standards
4.7.1 European Union Framework
4.7.2 China
4.7.3 United States
4.7.4 Green Building Standards and Industry Frameworks
4.8 Porter’s Five Forces Analysis
4.8.1 Threat of New Entrants
4.8.2 Bargaining Power of Suppliers
4.8.3 Bargaining Power of Buyers
4.8.4 Threat of Substitutes
4.8.5 Competitive Rivalry
5. Global Hyperscale Data Center Market, by Component
5.1 Overview
5.2 Solutions
5.2.1 IT Infrastructure
5.2.1.1 Servers
5.2.1.2 Storage Systems
5.2.1.3 Networking Equipment
5.2.2 Facility Infrastructure
5.2.2.1 Power Infrastructure
5.2.2.2 Cooling Systems
5.2.2.3 Racks and Enclosures
5.2.3 Software
5.2.3.1 Data Center Infrastructure Management (DCIM)
5.2.3.2 Software-Defined Networking (SDN)
5.2.3.3 Virtualization Platforms
5.2.3.4 Infrastructure Automation
5.3 Services
5.3.1 Design and Consulting
5.3.2 Installation and Deployment
5.3.3 Maintenance and Support
5.3.4 Managed Services
6. Global Hyperscale Data Center Market, by Power Capacity
6.1 Overview
6.2 20 MW to 50 MW
6.3 50 MW to 100 MW
6.4 100 MW to 150 MW
6.5 150 MW and Above
7. Global Hyperscale Data Center Market, by End-User
7.1 Overview
7.2 Cloud Providers
7.3 Colocation Providers
7.4 Technology Providers
7.5 Enterprises
7.5.1 Telecom
7.5.2 BFSI
7.5.3 Media and Entertainment
7.5.4 Retail and E-Commerce
7.5.5 Healthcare
7.5.6 Government and Defense
7.5.7 Others (Manufacturing and Energy)
8. Hyperscale Data Center Market Assessment, by Geography
8.1 Overview
8.2 North America
8.2.1 U.S.
8.2.2 Canada
8.3 Europe
8.3.1 Germany
8.3.2 France
8.3.3 U.K.
8.3.4 Italy
8.3.5 Spain
8.3.6 Netherlands
8.3.7 Nordics
8.3.8 Rest of Europe
8.4 Asia-Pacific
8.4.1 China
8.4.2 India
8.4.3 Japan
8.4.4 South Korea
8.4.5 Singapore
8.4.6 Australia
8.4.7 Indonesia
8.4.8 Vietnam
8.4.9 Rest of Asia-Pacific
8.5 Latin America
8.5.1 Brazil
8.5.2 Mexico
8.5.3 Argentina
8.5.4 Chile
8.5.5 Colombia
8.5.6 Rest of Latin America
8.6 Middle East & Africa
8.6.1 Saudi Arabia
8.6.2 UAE
8.6.3 South Africa
8.6.4 Israel
8.6.5 Egypt
8.6.6 Nigeria
8.6.7 Rest of Middle East & Africa
9. Competitive Landscape
9.1 Introduction
9.2 Competitive Benchmarking
9.3 Competitive Dashboard
9.3.1 Industry Leaders
9.3.2 Market Differentiators
9.3.3 Vanguards
9.3.4 Emerging Companies
9.4 Market Share/Position Analysis
10. Company Profiles
10.1 Nvidia Corporation
10.1.1 Company Overview
10.1.2 Financial Overview
10.1.3 Product Portfolio
10.1.4 Strategic Developments
10.1.5 SWOT Analysis
10.2 Cisco Systems, Inc.
10.2.1 Company Overview
10.2.2 Financial Overview
10.2.3 Product Portfolio
10.2.4 SWOT Analysis
10.3 Intel Corporation
10.3.1 Company Overview
10.3.2 Financial Overview
10.3.3 Product Portfolio
10.3.4 SWOT Analysis
10.4 Lenovo
10.4.1 Company Overview
10.4.2 Financial Overview
10.4.3 Product Portfolio
10.4.4 SWOT Analysis
10.5 Eaton
10.5.1 Company Overview
10.5.2 Financial Overview
10.5.3 Product Portfolio
10.5.4 SWOT Analysis
10.6 ABB
10.6.1 Company Overview
10.6.2 Financial Overview
10.6.3 Product Portfolio
10.6.4 SWOT Analysis
10.7 Rittal GmbH & Co. KG
10.7.1 Company Overview
10.7.2 Product Portfolio
10.7.3 SWOT Analysis
10.8 International Business Machines Corporation (IBM)
10.8.1 Company Overview
10.8.2 Financial Overview
10.8.3 Product Portfolio
10.8.4 SWOT Analysis
10.9 Microsoft Corporation
10.9.1 Company Overview
10.9.2 Financial Overview
10.9.3 Product Portfolio
10.9.4 Strategic Developments
10.9.5 SWOT Analysis
10.10 VMware
10.10.1 Company Overview
10.10.2 Product Portfolio
10.10.3 SWOT Analysis
10.11 Nutanix, Inc.
10.11.1 Company Overview
10.11.2 Financial Overview
10.11.3 Product Portfolio
10.11.4 SWOT Analysis
10.12 Dell Technologies Inc.
10.12.1 Company Overview
10.12.2 Financial Overview
10.12.3 Product Portfolio
10.12.4 SWOT Analysis
10.13 Super Micro Computer (Supermicro)
10.13.1 Company Overview
10.13.2 Financial Overview
10.13.3 Product Portfolio
10.13.4 SWOT Analysis
10.14 Schneider Electric SE
10.14.1 Company Overview
10.14.2 Financial Overview
10.14.3 Product Portfolio
10.14.4 SWOT Analysis
10.15 Vertiv Holdings Co.
10.15.1 Company Overview
10.15.2 Financial Overview
10.15.3 Product Portfolio
10.15.4 SWOT Analysis
10.16 Huawei Technologies Co., Ltd.
10.16.1 Company Overview
10.16.2 Product Portfolio
10.16.3 SWOT Analysis
10.17 Hewlett Packard Enterprise (HPE)
10.17.1 Company Overview
10.17.2 Financial Overview
10.17.3 Product Portfolio
10.17.4 SWOT Analysis
10.18 Arista Networks, Inc.
10.18.1 Company Overview
10.18.2 Financial Overview
10.18.3 Product Portfolio
10.18.4 SWOT Analysis
10.19 NTT Data
10.19.1 Company Overview
10.19.2 Financial Overview
10.19.3 Product Portfolio
10.19.4 SWOT Analysis
10.20 Accenture Plc
10.20.1 Company Overview
10.20.2 Financial Overview
10.20.3 Product Portfolio
10.20.4 SWOT Analysis
10.21 Kyndryl Holdings, Inc.
10.21.1 Company Overview
10.21.2 Financial Overview
10.21.3 Product Portfolio
10.21.4 SWOT Analysis
11. Appendix
11.1 Available Customization
11.2 Related Reports
List of tables
Table 1 Global Hyperscale Data Center Market Drivers: Impact Analysis (2025–2036)
Table 2 Global Hyperscale Data Center Market Restraints: Impact Analysis (2025–2036)
Table 3 Global Hyperscale Data Center Market Opportunities: Impact Analysis (2025–2036)
Table 4 Global Hyperscale Data Center Market Challenges: Impact Analysis (2025–2036)
Table 5 Ai Impact Vs. Sustainability Response in Hyperscale Data Centers
Table 6 Global Regulatory Framework and Green Building Standards For Hyperscale Data Centers
Table 7 Global Hyperscale Data Center Market – Porter's Five Forces Summary (2025–2026)
Table 8 Global Hyperscale Data Center Market, By Component — Impact Analysis (2026–2036)
Table 9 Global Hyperscale Data Centers Market, By Component, 2024-2036 (USD Million)
Table 10 Global Hyperscale Data Center Market, By Component — Impact Analysis (2026–2036)
Table 11 Global Hyperscale Data Center Solutions Market, By Type, 2024-2036 (USD Million)
Table 12 Global Hyperscale Data Center Solutions Market, By Country/Region, 2024-2036 ($Million)
Table 13 Global Hyperscale Data Center It Infrastructure Solutions Market, By Type, 2024-2036 (USD Million)
Table 14 Global Hyperscale Data Center It Infrastructure Solutions Market, By Country/Region, 2024-2036 ($Million)
Table 15 Global Hyperscale Data Center Server Market, By Country/Region, 2024-2036 ($Million)
Table 16 Global Hyperscale Data Center Storage Systems Market, By Country/Region, 2024-2036 ($Million)
Table 17 Global Hyperscale Data Center Networking Equipment Market, By Country/Region, 2024-2036 ($Million)
Table 18 Global Hyperscale Data Center Facility Infrastructure Solutions Market, By Type, 2024-2036 (USD Million)
Table 19 Global Hyperscale Data Center Facility Infrastructure Solutions Market, By Country/Region, 2024-2036 ($Million)
Table 20 Global Hyperscale Data Center Power Infrastructure Market, By Country/Region, 2024-2036 ($Million)
Table 21 Global Hyperscale Data Center Cooling Systems Market, By Country/Region, 2024-2036 ($Million)
Table 22 Global Hyperscale Data Center Racks and Enclosures Market, By Country/Region, 2024-2036 ($Million)
Table 23 Global Hyperscale Data Center Software Solutions Market, By Type, 2024-2036 (USD Million)
Table 24 Global Hyperscale Data Center Software Solutions Market, By Country/Region, 2024-2036 ($Million)
Table 25 Global Hyperscale Data Center Data Center Infrastructure Management (Dcim) Market, By Country/Region, 2024-2036 ($Million)
Table 26 Global Hyperscale Data Center Software-Defined Networking (Sdn) Market, By Country/Region, 2024-2036 ($Million)
Table 27 Global Hyperscale Data Center Virtualization Platforms Market, By Country/Region, 2024-2036 ($Million)
Table 28 Global Hyperscale Data Center Infrastructure Automation Market, By Country/Region, 2024-2036 ($Million)
Table 29 Global Hyperscale Data Center Market (Services Segment) — Impact Analysis (2026–2036)
Table 30 Global Hyperscale Data Center Services Market, By Type, 2024-2036 (USD Million)
Table 31 Global Hyperscale Data Center Services Market, By Country/Region, 2024-2036 ($Million)
Table 32 Global Hyperscale Data Center Design and Consulting Services Market, By Country/Region, 2024-2036 ($Million)
Table 33 Global Hyperscale Data Center Installation and Deployment Market, By Country/Region, 2024-2036 ($Million)
Table 34 Global Hyperscale Data Center Maintenance & Support Market, By Country/Region, 2024-2036 ($Million)
Table 35 Global Hyperscale Data Center Managed Services Market, By Country/Region, 2024-2036 ($Million)
Table 36 Global Hyperscale Data Center Market — Power Capacity Segment Overview (2026)
Table 37 Global Hyperscale Data Centers Market, By Power Capacity, 2024-2036 (USD Million)
Table 38 Global Hyperscale Data Center Market (20 Mw To 50 Mw Segment) — Impact Analysis (2026–2036)
Table 39 Global 20 Mw To 50 Mw Hyperscale Data Center Market, By Country/Region, 2024-2036 ($Million)
Table 40 Global Hyperscale Data Center Market (50 Mw To 100 Mw Segment) — Impact Analysis (2026–2036)
Table 41 Global 50 Mw – 100 Mw Hyperscale Data Center Market, By Country/Region, 2024-2036 ($Million)
Table 42 Global Hyperscale Data Center Market (100 Mw To 150 Mw Segment) — Impact Analysis (2026–2036)
Table 43 Global 100 Mw – 150 Mw Hyperscale Data Center Market, By Country/Region, 2024-2036 ($Million)
Table 44 Global Hyperscale Data Center Market (150 Mw and Above Segment) — Impact Analysis (2026–2036)
Table 45 Global 150 Mw+ Hyperscale Data Center Market, By Country/Region, 2024-2036 ($Million)
Table 46 Global Hyperscale Data Center Market — End User Segment Overview (2026)
Table 47 Global Hyperscale Data Centers Market, By End User, 2024-2036 (USD Million)
Table 48 Global Hyperscale Data Center Market (Cloud Providers Segment) — Impact Analysis (2026–2036)
Table 49 Global Hyperscale Data Center Market for Cloud Providers, By Country/Region, 2024-2036 ($Million)
Table 50 Global Hyperscale Data Center Market (Colocation Providers Segment) — Impact Analysis (2026–2036)
Table 51 Global Hyperscale Data Center Market for Colocation Providers, By Country/Region, 2024-2036 ($Million)
Table 52 Global Hyperscale Data Center Market (Technology Providers Segment) — Impact Analysis (2026–2036)
Table 53 Global Hyperscale Data Center Market for Technology Providers, By Country/Region, 2024-2036 ($Million)
Table 54 Global Hyperscale Data Center Market (Enterprises Segment) — Impact Analysis (2026–2036)
Table 55 Global Hyperscale Data Centers Market for Enterprises End User, By Type, 2024-2036 (USD Million)
Table 56 Global Hyperscale Data Center Market for Enterprises, By Country/Region, 2024-2036 ($Million)
Table 57 Global Hyperscale Data Center Market for Telecom, By Country/Region, 2024-2036 ($Million)
Table 58 Global Hyperscale Data Center Market for Banking, Financial Services, And Insurance (Bfsi), By Country/Region, 2024-2036 ($Million)
Table 59 Global Hyperscale Data Center Market for Media and Entertainment, By Country/Region, 2024-2036 ($Million)
Table 60 Global Hyperscale Data Center Market for Retail and E Commerce, By Country/Region, 2024-2036 ($Million)
Table 61 Global Hyperscale Data Center Market for Healthcare, By Country/Region, 2024-2036 ($Million)
Table 62 Global Hyperscale Data Center Market for Government and Defense, By Country/Region, 2024-2036 ($Million)
Table 63 Global Hyperscale Data Center Market (Enterprises Sub-Segments) — Impact Analysis (2026–2036)
Table 64 Global Hyperscale Data Center Market for Other Enterprises, By Country/Region, 2024-2036 ($Million)
Table 65 Global Hyperscale Data Center Market — Geographic Overview (2026)
Table 66 Global Hyperscale Data Center Market (North America) — Impact Analysis (2026–2036)
Table 67 North America: Hyperscale Data Centers Market, By Country, 2023–2035 (USD Million)
Table 68 North America: Hyperscale Data Centers Market, By Component, 2024-2036 (USD Million)
Table 69 North America: Hyperscale Data Center Solutions Market, By Type, 2024-2036 (USD Million)
Table 70 North America: Hyperscale Data Center It Infrastructure Solutions Market, By Type, 2024-2036 (USD Million)
Table 71 North America: Hyperscale Data Center Facility Infrastructure Solutions Market, By Type, 2024-2036 (USD Million)
Table 72 North America: Hyperscale Data Center Software Solutions Market, By Type, 2024-2036 (USD Million)
Table 73 North America: Hyperscale Data Center Services Market, By Type, 2024-2036 (USD Million)
Table 74 North America: Hyperscale Data Centers Market, By Power Capacity, 2024-2036 (USD Million)
Table 75 North America: Hyperscale Data Centers Market, By End User, 2024-2036 (USD Million)
Table 76 North America: Hyperscale Data Centers Market for Enterprises End User, By Type, 2024-2036 (USD Million)
Table 77 U.S. Hyperscale Data Center Market — Key Macroindicators (2025)
Table 78 U.S.: Hyperscale Data Centers Market, By Component, 2024-2036 (USD Million)
Table 79 U.S.: Hyperscale Data Center Solutions Market, By Type, 2024-2036 (USD Million)
Table 80 U.S.: Hyperscale Data Center It Infrastructure Solutions Market, By Type, 2024-2036 (USD Million)
Table 81 U.S.: Hyperscale Data Center Facility Infrastructure Solutions Market, By Type, 2024-2036 (USD Million)
Table 82 U.S.: Hyperscale Data Center Software Solutions Market, By Type, 2024-2036 (USD Million)
Table 83 U.S.: Hyperscale Data Center Services Market, By Type, 2024-2036 (USD Million)
Table 84 U.S.: Hyperscale Data Centers Market, By Power Capacity, 2024-2036 (USD Million)
Table 85 U.S.: Hyperscale Data Centers Market, By End User, 2024-2036 (USD Million)
Table 86 U.S.: Hyperscale Data Centers Market for Enterprises End User, By Type, 2024-2036 (USD Million)
Table 87 Canada Hyperscale Data Center Market — Key Macroindicators (2025)
Table 88 Canada: Hyperscale Data Centers Market, By Component, 2024-2036 (USD Million)
Table 89 Canada: Hyperscale Data Center Solutions Market, By Type, 2024-2036 (USD Million)
Table 90 Canada: Hyperscale Data Center It Infrastructure Solutions Market, By Type, 2024-2036 (USD Million)
Table 91 Canada: Hyperscale Data Center Facility Infrastructure Solutions Market, By Type, 2024-2036 (USD Million)
Table 92 Canada: Hyperscale Data Center Software Solutions Market, By Type, 2024-2036 (USD Million)
Table 93 Canada: Hyperscale Data Center Services Market, By Type, 2024-2036 (USD Million)
Table 94 Canada: Hyperscale Data Centers Market, By Power Capacity, 2024-2036 (USD Million)
Table 95 Canada: Hyperscale Data Centers Market, By End User, 2024-2036 (USD Million)
Table 96 Canada: Hyperscale Data Centers Market for Enterprises End User, By Type, 2024-2036 (USD Million)
Table 97 Global Hyperscale Data Center Market (Europe) — Impact Analysis (2026–2036)
Table 98 Europe: Hyperscale Data Center Market, By Country, 2023-2035 (USD Million)
Table 99 Europe: Hyperscale Data Centers Market, By Component, 2024-2036 (USD Million)
Table 100 Europe: Hyperscale Data Center Solutions Market, By Type, 2024-2036 (USD Million)
Table 101 Europe: Hyperscale Data Center It Infrastructure Solutions Market, By Type, 2024-2036 (USD Million)
Table 102 Europe: Hyperscale Data Center Facility Infrastructure Solutions Market, By Type, 2024-2036 (USD Million)
Table 103 Europe: Hyperscale Data Center Software Solutions Market, By Type, 2024-2036 (USD Million)
Table 104 Europe: Hyperscale Data Center Services Market, By Type, 2024-2036 (USD Million)
Table 105 Europe: Hyperscale Data Centers Market, By Power Capacity, 2024-2036 (USD Million)
Table 106 Europe: Hyperscale Data Centers Market, By End User, 2024-2036 (USD Million)
Table 107 Europe: Hyperscale Data Centers Market for Enterprises End User, By Type, 2024-2036 (USD Million)
Table 108 Germany Hyperscale Data Center Market — Key Macroindicators (2025)
Table 109 Germany: Hyperscale Data Centers Market, By Component, 2024-2036 (USD Million)
Table 110 Germany: Hyperscale Data Center Solutions Market, By Type, 2024-2036 (USD Million)
Table 111 Germany: Hyperscale Data Center It Infrastructure Solutions Market, By Type, 2024-2036 (USD Million)
Table 112 Germany: Hyperscale Data Center Facility Infrastructure Solutions Market, By Type, 2024-2036 (USD Million)
Table 113 Germany: Hyperscale Data Center Software Solutions Market, By Type, 2024-2036 (USD Million)
Table 114 Germany: Hyperscale Data Center Services Market, By Type, 2024-2036 (USD Million)
Table 115 Germany: Hyperscale Data Centers Market, By Power Capacity, 2024-2036 (USD Million)
Table 116 Germany: Hyperscale Data Centers Market, By End User, 2024-2036 (USD Million)
Table 117 Germany: Hyperscale Data Centers Market for Enterprises End User, By Type, 2024-2036 (USD Million)
Table 118 France Hyperscale Data Center Market — Key Macroindicators (2025)
Table 119 France: Hyperscale Data Centers Market, By Component, 2024-2036 (USD Million)
Table 120 France: Hyperscale Data Center Solutions Market, By Type, 2024-2036 (USD Million)
Table 121 France: Hyperscale Data Center It Infrastructure Solutions Market, By Type, 2024-2036 (USD Million)
Table 122 France: Hyperscale Data Center Facility Infrastructure Solutions Market, By Type, 2024-2036 (USD Million)
Table 123 France: Hyperscale Data Center Software Solutions Market, By Type, 2024-2036 (USD Million)
Table 124 France: Hyperscale Data Center Services Market, By Type, 2024-2036 (USD Million)
Table 125 France: Hyperscale Data Centers Market, By Power Capacity, 2024-2036 (USD Million)
Table 126 France: Hyperscale Data Centers Market, By End User, 2024-2036 (USD Million)
Table 127 France: Hyperscale Data Centers Market for Enterprises End User, By Type, 2024-2036 (USD Million)
Table 128 U.K. Hyperscale Data Center Market — Key Macroindicators (2025)
Table 129 U.K.: Hyperscale Data Centers Market, By Component, 2024-2036 (USD Million)
Table 130 U.K.: Hyperscale Data Center Solutions Market, By Type, 2024-2036 (USD Million)
Table 131 U.K.: Hyperscale Data Center It Infrastructure Solutions Market, By Type, 2024-2036 (USD Million)
Table 132 U.K.: Hyperscale Data Center Facility Infrastructure Solutions Market, By Type, 2024-2036 (USD Million)
Table 133 U.K.: Hyperscale Data Center Software Solutions Market, By Type, 2024-2036 (USD Million)
Table 134 U.K.: Hyperscale Data Center Services Market, By Type, 2024-2036 (USD Million)
Table 135 U.K.: Hyperscale Data Centers Market, By Power Capacity, 2024-2036 (USD Million)
Table 136 U.K.: Hyperscale Data Centers Market, By End User, 2024-2036 (USD Million)
Table 137 U.K.: Hyperscale Data Centers Market for Enterprises End User, By Type, 2024-2036 (USD Million)
Table 138 Italy Hyperscale Data Center Market — Key Macroindicators (2025)
Table 139 Italy: Hyperscale Data Centers Market, By Component, 2024-2036 (USD Million)
Table 140 Italy: Hyperscale Data Center Solutions Market, By Type, 2024-2036 (USD Million)
Table 141 Italy: Hyperscale Data Center It Infrastructure Solutions Market, By Type, 2024-2036 (USD Million)
Table 142 Italy: Hyperscale Data Center Facility Infrastructure Solutions Market, By Type, 2024-2036 (USD Million)
Table 143 Italy: Hyperscale Data Center Software Solutions Market, By Type, 2024-2036 (USD Million)
Table 144 Italy: Hyperscale Data Center Services Market, By Type, 2024-2036 (USD Million)
Table 145 Italy: Hyperscale Data Centers Market, By Power Capacity, 2024-2036 (USD Million)
Table 146 Italy: Hyperscale Data Centers Market, By End User, 2024-2036 (USD Million)
Table 147 Italy: Hyperscale Data Centers Market for Enterprises End User, By Type, 2024-2036 (USD Million)
Table 148 Spain Hyperscale Data Center Market — Key Macroindicators (2025)
Table 149 Spain: Hyperscale Data Centers Market, By Component, 2024-2036 (USD Million)
Table 150 Spain: Hyperscale Data Center Solutions Market, By Type, 2024-2036 (USD Million)
Table 151 Spain: Hyperscale Data Center It Infrastructure Solutions Market, By Type, 2024-2036 (USD Million)
Table 152 Spain: Hyperscale Data Center Facility Infrastructure Solutions Market, By Type, 2024-2036 (USD Million)
Table 153 Spain: Hyperscale Data Center Software Solutions Market, By Type, 2024-2036 (USD Million)
Table 154 Spain: Hyperscale Data Center Services Market, By Type, 2024-2036 (USD Million)
Table 155 Spain: Hyperscale Data Centers Market, By Power Capacity, 2024-2036 (USD Million)
Table 156 Spain: Hyperscale Data Centers Market, By End User, 2024-2036 (USD Million)
Table 157 Spain: Hyperscale Data Centers Market for Enterprises End User, By Type, 2024-2036 (USD Million)
Table 158 Netherlands Hyperscale Data Center Market — Key Macroindicators (2025)
Table 159 Netherlands: Hyperscale Data Centers Market, By Component, 2024-2036 (USD Million)
Table 160 Netherlands: Hyperscale Data Center Solutions Market, By Type, 2024-2036 (USD Million)
Table 161 Netherlands: Hyperscale Data Center It Infrastructure Solutions Market, By Type, 2024-2036 (USD Million)
Table 162 Netherlands: Hyperscale Data Center Facility Infrastructure Solutions Market, By Type, 2024-2036 (USD Million)
Table 163 Netherlands: Hyperscale Data Center Software Solutions Market, By Type, 2024-2036 (USD Million)
Table 164 Netherlands: Hyperscale Data Center Services Market, By Type, 2024-2036 (USD Million)
Table 165 Netherlands: Hyperscale Data Centers Market, By Power Capacity, 2024-2036 (USD Million)
Table 166 Netherlands: Hyperscale Data Centers Market, By End User, 2024-2036 (USD Million)
Table 167 Netherlands: Hyperscale Data Centers Market for Enterprises End User, By Type, 2024-2036 (USD Million)
Table 168 Nordics Hyperscale Data Center Market — Key Macroindicators (2025)
Table 169 Nordics: Hyperscale Data Centers Market, By Component, 2024-2036 (USD Million)
Table 170 Nordics: Hyperscale Data Center Solutions Market, By Type, 2024-2036 (USD Million)
Table 171 Nordics: Hyperscale Data Center It Infrastructure Solutions Market, By Type, 2024-2036 (USD Million)
Table 172 Nordics: Hyperscale Data Center Facility Infrastructure Solutions Market, By Type, 2024-2036 (USD Million)
Table 173 Nordics: Hyperscale Data Center Software Solutions Market, By Type, 2024-2036 (USD Million)
Table 174 Nordics: Hyperscale Data Center Services Market, By Type, 2024-2036 (USD Million)
Table 175 Nordics: Hyperscale Data Centers Market, By Power Capacity, 2024-2036 (USD Million)
Table 176 Nordics: Hyperscale Data Centers Market, By End User, 2024-2036 (USD Million)
Table 177 Nordics: Hyperscale Data Centers Market for Enterprises End User, By Type, 2024-2036 (USD Million)
Table 178 Rest of Europe Hyperscale Data Center Market — Key Macroindicators (2025)
Table 179 Rest of Europe: Hyperscale Data Centers Market, By Component, 2024-2036 (USD Million)
Table 180 Rest of Europe: Hyperscale Data Center Solutions Market, By Type, 2024-2036 (USD Million)
Table 181 Rest of Europe: Hyperscale Data Center It Infrastructure Solutions Market, By Type, 2024-2036 (USD Million)
Table 182 Rest of Europe: Hyperscale Data Center Facility Infrastructure Solutions Market, By Type, 2024-2036 (USD Million)
Table 183 Rest of Europe: Hyperscale Data Center Software Solutions Market, By Type, 2024-2036 (USD Million)
Table 184 Rest of Europe: Hyperscale Data Center Services Market, By Type, 2024-2036 (USD Million)
Table 185 Rest of Europe: Hyperscale Data Centers Market, By Power Capacity, 2024-2036 (USD Million)
Table 186 Rest of Europe: Hyperscale Data Centers Market, By End User, 2024-2036 (USD Million)
Table 187 Rest of Europe: Hyperscale Data Centers Market for Enterprises End User, By Type, 2024-2036 (USD Million)
Table 188 Global Hyperscale Data Center Market (Asia-Pacific) — Impact Analysis (2026–2036)
Table 189 Asia-Pacific: Hyperscale Data Centers Market, By Country, 2023–2035 (USD Million)
Table 190 Asia-Pacific: Hyperscale Data Centers Market, By Component, 2024-2036 (USD Million)
Table 191 Asia-Pacific: Hyperscale Data Center Solutions Market, By Type, 2024-2036 (USD Million)
Table 192 Asia-Pacific: Hyperscale Data Center It Infrastructure Solutions Market, By Type, 2024-2036 (USD Million)
Table 193 Asia-Pacific: Hyperscale Data Center Facility Infrastructure Solutions Market, By Type, 2024-2036 (USD Million)
Table 194 Asia-Pacific: Hyperscale Data Center Software Solutions Market, By Type, 2024-2036 (USD Million)
Table 195 Asia-Pacific: Hyperscale Data Center Services Market, By Type, 2024-2036 (USD Million)
Table 196 Asia-Pacific: Hyperscale Data Centers Market, By Power Capacity, 2024-2036 (USD Million)
Table 197 Asia-Pacific: Hyperscale Data Centers Market, By End User, 2024-2036 (USD Million)
Table 198 Asia-Pacific: Hyperscale Data Centers Market for Enterprises End User, By Type, 2024-2036 (USD Million)
Table 199 China Hyperscale Data Center Market — Key Macroindicators (2025)
Table 200 China: Hyperscale Data Centers Market, By Component, 2024-2036 (USD Million)
Table 201 China: Hyperscale Data Center Solutions Market, By Type, 2024-2036 (USD Million)
Table 202 China: Hyperscale Data Center It Infrastructure Solutions Market, By Type, 2024-2036 (USD Million)
Table 203 China: Hyperscale Data Center Facility Infrastructure Solutions Market, By Type, 2024-2036 (USD Million)
Table 204 China: Hyperscale Data Center Software Solutions Market, By Type, 2024-2036 (USD Million)
Table 205 China: Hyperscale Data Center Services Market, By Type, 2024-2036 (USD Million)
Table 206 China: Hyperscale Data Centers Market, By Power Capacity, 2024-2036 (USD Million)
Table 207 China: Hyperscale Data Centers Market, By End User, 2024-2036 (USD Million)
Table 208 China: Hyperscale Data Centers Market for Enterprises End User, By Type, 2024-2036 (USD Million)
Table 209 India Hyperscale Data Center Market — Key Macroindicators (2025)
Table 210 India: Hyperscale Data Centers Market, By Component, 2024-2036 (USD Million)
Table 211 India: Hyperscale Data Center Solutions Market, By Type, 2024-2036 (USD Million)
Table 212 India: Hyperscale Data Center It Infrastructure Solutions Market, By Type, 2024-2036 (USD Million)
Table 213 India: Hyperscale Data Center Facility Infrastructure Solutions Market, By Type, 2024-2036 (USD Million)
Table 214 India: Hyperscale Data Center Software Solutions Market, By Type, 2024-2036 (USD Million)
Table 215 India: Hyperscale Data Center Services Market, By Type, 2024-2036 (USD Million)
Table 216 India: Hyperscale Data Centers Market, By Power Capacity, 2024-2036 (USD Million)
Table 217 India: Hyperscale Data Centers Market, By End User, 2024-2036 (USD Million)
Table 218 India: Hyperscale Data Centers Market for Enterprises End User, By Type, 2024-2036 (USD Million)
Table 219 Japan Hyperscale Data Center Market — Key Macroindicators (2025)
Table 220 Japan: Hyperscale Data Centers Market, By Component, 2024-2036 (USD Million)
Table 221 Japan: Hyperscale Data Center Solutions Market, By Type, 2024-2036 (USD Million)
Table 222 Japan: Hyperscale Data Center It Infrastructure Solutions Market, By Type, 2024-2036 (USD Million)
Table 223 Japan: Hyperscale Data Center Facility Infrastructure Solutions Market, By Type, 2024-2036 (USD Million)
Table 224 Japan: Hyperscale Data Center Software Solutions Market, By Type, 2024-2036 (USD Million)
Table 225 Japan: Hyperscale Data Center Services Market, By Type, 2024-2036 (USD Million)
Table 226 Japan: Hyperscale Data Centers Market, By Power Capacity, 2024-2036 (USD Million)
Table 227 Japan: Hyperscale Data Centers Market, By End User, 2024-2036 (USD Million)
Table 228 Japan: Hyperscale Data Centers Market for Enterprises End User, By Type, 2024-2036 (USD Million)
Table 229 South Korea Hyperscale Data Center Market — Key Macroindicators (2025)
Table 230 South Korea: Hyperscale Data Centers Market, By Component, 2024-2036 (USD Million)
Table 231 South Korea: Hyperscale Data Center Solutions Market, By Type, 2024-2036 (USD Million)
Table 232 South Korea: Hyperscale Data Center It Infrastructure Solutions Market, By Type, 2024-2036 (USD Million)
Table 233 South Korea: Hyperscale Data Center Facility Infrastructure Solutions Market, By Type, 2024-2036 (USD Million)
Table 234 South Korea: Hyperscale Data Center Software Solutions Market, By Type, 2024-2036 (USD Million)
Table 235 South Korea: Hyperscale Data Center Services Market, By Type, 2024-2036 (USD Million)
Table 236 South Korea: Hyperscale Data Centers Market, By Power Capacity, 2024-2036 (USD Million)
Table 237 South Korea: Hyperscale Data Centers Market, By End User, 2024-2036 (USD Million)
Table 238 South Korea: Hyperscale Data Centers Market for Enterprises End User, By Type, 2024-2036 (USD Million)
Table 239 Singapore Hyperscale Data Center Market — Key Macroindicators (2025)
Table 240 Singapore: Hyperscale Data Centers Market, By Component, 2024-2036 (USD Million)
Table 241 Singapore: Hyperscale Data Center Solutions Market, By Type, 2024-2036 (USD Million)
Table 242 Singapore: Hyperscale Data Center It Infrastructure Solutions Market, By Type, 2024-2036 (USD Million)
Table 243 Singapore: Hyperscale Data Center Facility Infrastructure Solutions Market, By Type, 2024-2036 (USD Million)
Table 244 Singapore: Hyperscale Data Center Software Solutions Market, By Type, 2024-2036 (USD Million)
Table 245 Singapore: Hyperscale Data Center Services Market, By Type, 2024-2036 (USD Million)
Table 246 Singapore: Hyperscale Data Centers Market, By Power Capacity, 2024-2036 (USD Million)
Table 247 Singapore: Hyperscale Data Centers Market, By End User, 2024-2036 (USD Million)
Table 248 Singapore: Hyperscale Data Centers Market for Enterprises End User, By Type, 2024-2036 (USD Million)
Table 249 Australia Hyperscale Data Center Market — Key Macroindicators (2025)
Table 250 Australia: Hyperscale Data Centers Market, By Component, 2024-2036 (USD Million)
Table 251 Australia: Hyperscale Data Center Solutions Market, By Type, 2024-2036 (USD Million)
Table 252 Australia: Hyperscale Data Center It Infrastructure Solutions Market, By Type, 2024-2036 (USD Million)
Table 253 Australia: Hyperscale Data Center Facility Infrastructure Solutions Market, By Type, 2024-2036 (USD Million)
Table 254 Australia: Hyperscale Data Center Software Solutions Market, By Type, 2024-2036 (USD Million)
Table 255 Australia: Hyperscale Data Center Services Market, By Type, 2024-2036 (USD Million)
Table 256 Australia: Hyperscale Data Centers Market, By Power Capacity, 2024-2036 (USD Million)
Table 257 Australia: Hyperscale Data Centers Market, By End User, 2024-2036 (USD Million)
Table 258 Australia: Hyperscale Data Centers Market for Enterprises End User, By Type, 2024-2036 (USD Million)
Table 259 Indonesia Hyperscale Data Center Market — Key Macroindicators (2025)
Table 260 Indonesia: Hyperscale Data Centers Market, By Component, 2024-2036 (USD Million)
Table 261 Indonesia: Hyperscale Data Center Solutions Market, By Type, 2024-2036 (USD Million)
Table 262 Indonesia: Hyperscale Data Center It Infrastructure Solutions Market, By Type, 2024-2036 (USD Million)
Table 263 Indonesia: Hyperscale Data Center Facility Infrastructure Solutions Market, By Type, 2024-2036 (USD Million)
Table 264 Indonesia: Hyperscale Data Center Software Solutions Market, By Type, 2024-2036 (USD Million)
Table 265 Indonesia: Hyperscale Data Center Services Market, By Type, 2024-2036 (USD Million)
Table 266 Indonesia: Hyperscale Data Centers Market, By Power Capacity, 2024-2036 (USD Million)
Table 267 Indonesia: Hyperscale Data Centers Market, By End User, 2024-2036 (USD Million)
Table 268 Indonesia: Hyperscale Data Centers Market for Enterprises End User, By Type, 2024-2036 (USD Million)
Table 269 Vietnam Hyperscale Data Center Market — Key Macroindicators (2025)
Table 270 Vietnam: Hyperscale Data Centers Market, By Component, 2024-2036 (USD Million)
Table 271 Vietnam: Hyperscale Data Center Solutions Market, By Type, 2024-2036 (USD Million)
Table 272 Vietnam: Hyperscale Data Center It Infrastructure Solutions Market, By Type, 2024-2036 (USD Million)
Table 273 Vietnam: Hyperscale Data Center Facility Infrastructure Solutions Market, By Type, 2024-2036 (USD Million)
Table 274 Vietnam: Hyperscale Data Center Software Solutions Market, By Type, 2024-2036 (USD Million)
Table 275 Vietnam: Hyperscale Data Center Services Market, By Type, 2024-2036 (USD Million)
Table 276 Vietnam: Hyperscale Data Centers Market, By Power Capacity, 2024-2036 (USD Million)
Table 277 Vietnam: Hyperscale Data Centers Market, By End User, 2024-2036 (USD Million)
Table 278 Vietnam: Hyperscale Data Centers Market for Enterprises End User, By Type, 2024-2036 (USD Million)
Table 279 Rest of Asia-Pacific Hyperscale Data Center Market — Key Macroindicators (2025)
Table 280 Rest of Asia-Pacific: Hyperscale Data Centers Market, By Component, 2024-2036 (USD Million)
Table 281 Rest of Asia-Pacific: Hyperscale Data Center Solutions Market, By Type, 2024-2036 (USD Million)
Table 282 Rest of Asia-Pacific: Hyperscale Data Center It Infrastructure Solutions Market, By Type, 2024-2036 (USD Million)
Table 283 Rest of Asia-Pacific: Hyperscale Data Center Facility Infrastructure Solutions Market, By Type, 2024-2036 (USD Million)
Table 284 Rest of Asia-Pacific: Hyperscale Data Center Software Solutions Market, By Type, 2024-2036 (USD Million)
Table 285 Rest of Asia-Pacific: Hyperscale Data Center Services Market, By Type, 2024-2036 (USD Million)
Table 286 Rest of Asia-Pacific: Hyperscale Data Centers Market, By Power Capacity, 2024-2036 (USD Million)
Table 287 Rest of Asia-Pacific: Hyperscale Data Centers Market, By End User, 2024-2036 (USD Million)
Table 288 Rest of Asia-Pacific: Hyperscale Data Centers Market For Enterprises End User, By Type, 2024-2036 (USD Million)
Table 289 Global Hyperscale Data Center Market (Latin America) — Impact Analysis (2026–2036)
Table 290 Latin America: Hyperscale Data Centers Market, By Country, 2023–2035 (USD Million)
Table 291 Latin America: Hyperscale Data Centers Market, By Component, 2024-2036 (USD Million)
Table 292 Latin America: Hyperscale Data Center Solutions Market, By Type, 2024-2036 (USD Million)
Table 293 Latin America: Hyperscale Data Center It Infrastructure Solutions Market, By Type, 2024-2036 (USD Million)
Table 294 Latin America: Hyperscale Data Center Facility Infrastructure Solutions Market, By Type, 2024-2036 (USD Million)
Table 295 Latin America: Hyperscale Data Center Software Solutions Market, By Type, 2024-2036 (USD Million)
Table 296 Latin America: Hyperscale Data Center Services Market, By Type, 2024-2036 (USD Million)
Table 297 Latin America: Hyperscale Data Centers Market, By Power Capacity, 2024-2036 (USD Million)
Table 298 Latin America: Hyperscale Data Centers Market, By End User, 2024-2036 (USD Million)
Table 299 Latin America: Hyperscale Data Centers Market for Enterprises End User, By Type, 2024-2036 (USD Million)
Table 300 Brazil Hyperscale Data Center Market — Key Macroindicators (2025)
Table 301 Brazil: Hyperscale Data Centers Market, By Component, 2024-2036 (USD Million)
Table 302 Brazil: Hyperscale Data Center Solutions Market, By Type, 2024-2036 (USD Million)
Table 303 Brazil: Hyperscale Data Center It Infrastructure Solutions Market, By Type, 2024-2036 (USD Million)
Table 304 Brazil: Hyperscale Data Center Facility Infrastructure Solutions Market, By Type, 2024-2036 (USD Million)
Table 305 Brazil: Hyperscale Data Center Software Solutions Market, By Type, 2024-2036 (USD Million)
Table 306 Brazil: Hyperscale Data Center Services Market, By Type, 2024-2036 (USD Million)
Table 307 Brazil: Hyperscale Data Centers Market, By Power Capacity, 2024-2036 (USD Million)
Table 308 Brazil: Hyperscale Data Centers Market, By End User, 2024-2036 (USD Million)
Table 309 Brazil: Hyperscale Data Centers Market for Enterprises End User, By Type, 2024-2036 (USD Million)
Table 310 Mexico Hyperscale Data Center Market — Key Macroindicators (2025)
Table 311 Mexico: Hyperscale Data Centers Market, By Component, 2024-2036 (USD Million)
Table 312 Mexico: Hyperscale Data Center Solutions Market, By Type, 2024-2036 (USD Million)
Table 313 Mexico: Hyperscale Data Center It Infrastructure Solutions Market, By Type, 2024-2036 (USD Million)
Table 314 Mexico: Hyperscale Data Center Facility Infrastructure Solutions Market, By Type, 2024-2036 (USD Million)
Table 315 Mexico: Hyperscale Data Center Software Solutions Market, By Type, 2024-2036 (USD Million)
Table 316 Mexico: Hyperscale Data Center Services Market, By Type, 2024-2036 (USD Million)
Table 317 Mexico: Hyperscale Data Centers Market, By Power Capacity, 2024-2036 (USD Million)
Table 318 Mexico: Hyperscale Data Centers Market, By End User, 2024-2036 (USD Million)
Table 319 Mexico: Hyperscale Data Centers Market for Enterprises End User, By Type, 2024-2036 (USD Million)
Table 320 Argentina Hyperscale Data Center Market — Key Macroindicators (2025)
Table 321 Argentina: Hyperscale Data Centers Market, By Component, 2024-2036 (USD Million)
Table 322 Argentina: Hyperscale Data Center Solutions Market, By Type, 2024-2036 (USD Million)
Table 323 Argentina: Hyperscale Data Center It Infrastructure Solutions Market, By Type, 2024-2036 (USD Million)
Table 324 Argentina: Hyperscale Data Center Facility Infrastructure Solutions Market, By Type, 2024-2036 (USD Million)
Table 325 Argentina: Hyperscale Data Center Software Solutions Market, By Type, 2024-2036 (USD Million)
Table 326 Argentina: Hyperscale Data Center Services Market, By Type, 2024-2036 (USD Million)
Table 327 Argentina: Hyperscale Data Centers Market, By Power Capacity, 2024-2036 (USD Million)
Table 328 Argentina: Hyperscale Data Centers Market, By End User, 2024-2036 (USD Million)
Table 329 Argentina: Hyperscale Data Centers Market for Enterprises End User, By Type, 2024-2036 (USD Million)
Table 330 Chile Hyperscale Data Center Market — Key Macroindicators (2025)
Table 331 Chile: Hyperscale Data Centers Market, By Component, 2024-2036 (USD Million)
Table 332 Chile: Hyperscale Data Center Solutions Market, By Type, 2024-2036 (USD Million)
Table 333 Chile: Hyperscale Data Center It Infrastructure Solutions Market, By Type, 2024-2036 (USD Million)
Table 334 Chile: Hyperscale Data Center Facility Infrastructure Solutions Market, By Type, 2024-2036 (USD Million)
Table 335 Chile: Hyperscale Data Center Software Solutions Market, By Type, 2024-2036 (USD Million)
Table 336 Chile: Hyperscale Data Center Services Market, By Type, 2024-2036 (USD Million)
Table 337 Chile: Hyperscale Data Centers Market, By Power Capacity, 2024-2036 (USD Million)
Table 338 Chile: Hyperscale Data Centers Market, By End User, 2024-2036 (USD Million)
Table 339 Chile: Hyperscale Data Centers Market for Enterprises End User, By Type, 2024-2036 (USD Million)
Table 340 Colombia Hyperscale Data Center Market — Key Macroindicators (2025)
Table 341 Colombia: Hyperscale Data Centers Market, By Component, 2024-2036 (USD Million)
Table 342 Colombia: Hyperscale Data Center Solutions Market, By Type, 2024-2036 (USD Million)
Table 343 Colombia: Hyperscale Data Center It Infrastructure Solutions Market, By Type, 2024-2036 (USD Million)
Table 344 Colombia: Hyperscale Data Center Facility Infrastructure Solutions Market, By Type, 2024-2036 (USD Million)
Table 345 Colombia: Hyperscale Data Center Software Solutions Market, By Type, 2024-2036 (USD Million)
Table 346 Colombia: Hyperscale Data Center Services Market, By Type, 2024-2036 (USD Million)
Table 347 Colombia: Hyperscale Data Centers Market, By Power Capacity, 2024-2036 (USD Million)
Table 348 Colombia: Hyperscale Data Centers Market, By End User, 2024-2036 (USD Million)
Table 349 Colombia: Hyperscale Data Centers Market for Enterprises End User, By Type, 2024-2036 (USD Million)
Table 350 Rest of Latin America Hyperscale Data Center Market — Key Macroindicators (2025)
Table 351 Rest of Latin America: Hyperscale Data Centers Market, By Component, 2024-2036 (USD Million)
Table 352 Rest of Latin America: Hyperscale Data Center Solutions Market, By Type, 2024-2036 (USD Million)
Table 353 Rest of Latin America: Hyperscale Data Center It Infrastructure Solutions Market, By Type, 2024-2036 (USD Million)
Table 354 Rest of Latin America: Hyperscale Data Center Facility Infrastructure Solutions Market, By Type, 2024-2036 (USD Million)
Table 355 Rest of Latin America: Hyperscale Data Center Software Solutions Market, By Type, 2024-2036 (USD Million)
Table 356 Rest of Latin America: Hyperscale Data Center Services Market, By Type, 2024-2036 (USD Million)
Table 357 Rest of Latin America: Hyperscale Data Centers Market, By Power Capacity, 2024-2036 (USD Million)
Table 358 Rest of Latin America: Hyperscale Data Centers Market, By End User, 2024-2036 (USD Million)
Table 359 Rest of Latin America: Hyperscale Data Centers Market For Enterprises End User, By Type, 2024-2036 (USD Million)
Table 360 Global Hyperscale Data Center Market (Middle East & Africa) — Impact Analysis (2026–2036)
Table 361 Hyperscale Data Centers Market, By Country, 2023–2035 (USD Million)
Table 362 Middle East and Africa: Hyperscale Data Centers Market, By Component, 2024-2036 (USD Million)
Table 363 Middle East and Africa: Hyperscale Data Center Solutions Market, By Type, 2024-2036 (USD Million)
Table 364 Middle East and Africa: Hyperscale Data Center It Infrastructure Solutions Market, By Type, 2024-2036 (USD Million)
Table 365 Middle East and Africa: Hyperscale Data Center Facility Infrastructure Solutions Market, By Type, 2024-2036 (USD Million)
Table 366 Middle East and Africa: Hyperscale Data Center Software Solutions Market, By Type, 2024-2036 (USD Million)
Table 367 Middle East and Africa: Hyperscale Data Center Services Market, By Type, 2024-2036 (USD Million)
Table 368 Middle East and Africa: Hyperscale Data Centers Market, By Power Capacity, 2024-2036 (USD Million)
Table 369 Middle East and Africa: Hyperscale Data Centers Market, By End User, 2024-2036 (USD Million)
Table 370 Middle East and Africa: Hyperscale Data Centers Market for Enterprises End User, By Type, 2024-2036 (USD Million)
Table 371 Saudi Arabia Hyperscale Data Center Market — Key Macroindicators (2025)
Table 372 Saudi Arabia: Hyperscale Data Centers Market, By Component, 2024-2036 (USD Million)
Table 373 Saudi Arabia: Hyperscale Data Center Solutions Market, By Type, 2024-2036 (USD Million)
Table 374 Saudi Arabia: Hyperscale Data Center It Infrastructure Solutions Market, By Type, 2024-2036 (USD Million)
Table 375 Saudi Arabia: Hyperscale Data Center Facility Infrastructure Solutions Market, By Type, 2024-2036 (USD Million)
Table 376 Saudi Arabia: Hyperscale Data Center Software Solutions Market, By Type, 2024-2036 (USD Million)
Table 377 Saudi Arabia: Hyperscale Data Center Services Market, By Type, 2024-2036 (USD Million)
Table 378 Saudi Arabia: Hyperscale Data Centers Market, By Power Capacity, 2024-2036 (USD Million)
Table 379 Saudi Arabia: Hyperscale Data Centers Market, By End User, 2024-2036 (USD Million)
Table 380 Saudi Arabia: Hyperscale Data Centers Market for Enterprises End User, By Type, 2024-2036 (USD Million)
Table 381 UAE Hyperscale Data Center Market — Key Macroindicators (2025)
Table 382 UAE: Hyperscale Data Centers Market, By Component, 2024-2036 (USD Million)
Table 383 UAE: Hyperscale Data Center Solutions Market, By Type, 2024-2036 (USD Million)
Table 384 UAE: Hyperscale Data Center It Infrastructure Solutions Market, By Type, 2024-2036 (USD Million)
Table 385 UAE: Hyperscale Data Center Facility Infrastructure Solutions Market, By Type, 2024-2036 (USD Million)
Table 386 UAE: Hyperscale Data Center Software Solutions Market, By Type, 2024-2036 (USD Million)
Table 387 UAE: Hyperscale Data Center Services Market, By Type, 2024-2036 (USD Million)
Table 388 UAE: Hyperscale Data Centers Market, By Power Capacity, 2024-2036 (USD Million)
Table 389 UAE: Hyperscale Data Centers Market, By End User, 2024-2036 (USD Million)
Table 390 UAE: Hyperscale Data Centers Market for Enterprises End User, By Type, 2024-2036 (USD Million)
Table 391 South Africa Hyperscale Data Center Market — Key Macroindicators (2025)
Table 392 South Africa: Hyperscale Data Centers Market, By Component, 2024-2036 (USD Million)
Table 393 South Africa: Hyperscale Data Center Solutions Market, By Type, 2024-2036 (USD Million)
Table 394 South Africa: Hyperscale Data Center It Infrastructure Solutions Market, By Type, 2024-2036 (USD Million)
Table 395 South Africa: Hyperscale Data Center Facility Infrastructure Solutions Market, By Type, 2024-2036 (USD Million)
Table 396 South Africa: Hyperscale Data Center Software Solutions Market, By Type, 2024-2036 (USD Million)
Table 397 South Africa: Hyperscale Data Center Services Market, By Type, 2024-2036 (USD Million)
Table 398 South Africa: Hyperscale Data Centers Market, By Power Capacity, 2024-2036 (USD Million)
Table 399 South Africa: Hyperscale Data Centers Market, By End User, 2024-2036 (USD Million)
Table 400 South Africa: Hyperscale Data Centers Market for Enterprises End User, By Type, 2024-2036 (USD Million)
Table 401 Israel Hyperscale Data Center Market — Key Macroindicators (2025)
Table 402 Israel: Hyperscale Data Centers Market, By Component, 2024-2036 (USD Million)
Table 403 Israel: Hyperscale Data Center Solutions Market, By Type, 2024-2036 (USD Million)
Table 404 Israel: Hyperscale Data Center It Infrastructure Solutions Market, By Type, 2024-2036 (USD Million)
Table 405 Israel: Hyperscale Data Center Facility Infrastructure Solutions Market, By Type, 2024-2036 (USD Million)
Table 406 Israel: Hyperscale Data Center Software Solutions Market, By Type, 2024-2036 (USD Million)
Table 407 Israel: Hyperscale Data Center Services Market, By Type, 2024-2036 (USD Million)
Table 408 Israel: Hyperscale Data Centers Market, By Power Capacity, 2024-2036 (USD Million)
Table 409 Israel: Hyperscale Data Centers Market, By End User, 2024-2036 (USD Million)
Table 410 Israel: Hyperscale Data Centers Market for Enterprises End User, By Type, 2024-2036 (USD Million)
Table 411 Egypt Hyperscale Data Center Market — Key Macroindicators (2025)
Table 412 Egypt: Hyperscale Data Centers Market, By Component, 2024-2036 (USD Million)
Table 413 Egypt: Hyperscale Data Center Solutions Market, By Type, 2024-2036 (USD Million)
Table 414 Egypt: Hyperscale Data Center It Infrastructure Solutions Market, By Type, 2024-2036 (USD Million)
Table 415 Egypt: Hyperscale Data Center Facility Infrastructure Solutions Market, By Type, 2024-2036 (USD Million)
Table 416 Egypt: Hyperscale Data Center Software Solutions Market, By Type, 2024-2036 (USD Million)
Table 417 Egypt: Hyperscale Data Center Services Market, By Type, 2024-2036 (USD Million)
Table 418 Egypt: Hyperscale Data Centers Market, By Power Capacity, 2024-2036 (USD Million)
Table 419 Egypt: Hyperscale Data Centers Market, By End User, 2024-2036 (USD Million)
Table 420 Egypt: Hyperscale Data Centers Market for Enterprises End User, By Type, 2024-2036 (USD Million)
Table 421 Nigeria Hyperscale Data Center Market — Key Macroindicators (2025)
Table 422 Nigeria: Hyperscale Data Centers Market, By Component, 2024-2036 (USD Million)
Table 423 Nigeria: Hyperscale Data Center Solutions Market, By Type, 2024-2036 (USD Million)
Table 424 Nigeria: Hyperscale Data Center It Infrastructure Solutions Market, By Type, 2024-2036 (USD Million)
Table 425 Nigeria: Hyperscale Data Center Facility Infrastructure Solutions Market, By Type, 2024-2036 (USD Million)
Table 426 Nigeria: Hyperscale Data Center Software Solutions Market, By Type, 2024-2036 (USD Million)
Table 427 Nigeria: Hyperscale Data Center Services Market, By Type, 2024-2036 (USD Million)
Table 428 Nigeria: Hyperscale Data Centers Market, By Power Capacity, 2024-2036 (USD Million)
Table 429 Nigeria: Hyperscale Data Centers Market, By End User, 2024-2036 (USD Million)
Table 430 Nigeria: Hyperscale Data Centers Market for Enterprises End User, By Type, 2024-2036 (USD Million)
Table 431 Rest of Middle East & Africa Hyperscale Data Center Market — Key Macroindicators (2025)
Table 432 Rest of Middle East & Africa: Hyperscale Data Centers Market, By Component, 2024-2036 (USD Million)
Table 433 Rest of Middle East & Africa: Hyperscale Data Center Solutions Market, By Type, 2024-2036 (USD Million)
Table 434 Rest of Middle East & Africa: Hyperscale Data Center It Infrastructure Solutions Market, By Type, 2024-2036 (USD Million)
Table 435 Rest of Middle East & Africa: Hyperscale Data Center Facility Infrastructure Solutions Market, By Type, 2024-2036 (USD Million)
Table 436 Rest of Middle East & Africa: Hyperscale Data Center Software Solutions Market, By Type, 2024-2036 (USD Million)
Table 437 Rest of Middle East & Africa: Hyperscale Data Center Services Market, By Type, 2024-2036 (USD Million)
Table 438 Rest of Middle East & Africa: Hyperscale Data Centers Market, By Power Capacity, 2024-2036 (USD Million)
Table 439 Rest of Middle East & Africa: Hyperscale Data Centers Market, By End User, 2024-2036 (USD Million)
Table 440 Rest of Middle East & Africa: Hyperscale Data Centers Market for Enterprises End User, By Type, 2024-2036 (USD Million)
List Of Figures
Figure 1 Research Process
Figure 2 Key Secondary Sources
Figure 3 Primary Research Techniques
Figure 4 Key Executives Interviewed
Figure 5 Breakdown of Primary Interviews (Supply-Side & Demand-Side)
Figure 6 Market Sizing and Growth Forecast Approach
Figure 7 Global Hyperscale Data Centers Market, By Component, 2026 Vs. 2036 (USD Million)
Figure 8 Global Hyperscale Data Centers Market, By Power Capacity, 2026 Vs. 2036 (USD Million)
Figure 9 Global Hyperscale Data Centers Market, By End User, 2026 Vs. 2036 (USD Million)
Figure 10 Hyperscale Data Centers Market, By Geography, 2026 Vs. 2036 (USD Million)
Figure 11 Global Hyperscale Data Centers Market, By Component, 2026 Vs. 2036 (USD Million)
Figure 12 Global Hyperscale Data Centers Market, By Power Capacity, 2026 Vs. 2036 (USD Million)
Figure 13 Global Hyperscale Data Centers Market, By End User, 2026 Vs. 2036 (USD Million)
Figure 14 Global Hyperscale Data Center Market, By Region, 2026 Vs. 2036 (USD Million)
Figure 15 North America: Hyperscale Data Center Market Snapshot
Figure 16 Europe: Hyperscale Data Center Market Snapshot
Figure 17 Hyperscale Data Centers: Competitive Benchmarking, By Region
Figure 18 Competitive Dashboard: Hyperscale Data Centers Market
Figure 19 Hyperscale Data Centers Market Position Analysis, 2025
Figure 20 Nvidia Corporation: Financial Overview (2025)
Figure 21 Cisco Systems, Inc.: Financial Overview (2025)
Figure 22 Intel Corporation: Financial Overview (2025)
Figure 23 Lenovo: Financial Overview (2025)
Figure 24 Eaton: Financial Overview (2025)
Figure 25 ABB: Financial Overview (2025)
Figure 26 IBM: Financial Overview (2025)
Figure 27 Microsoft Corporation: Financial Overview (2025)
Figure 28 Nutanix, Inc.: Financial Overview (2025)
Figure 29 Dell Technologies Inc.: Financial Overview (2025)
Figure 30 Super Micro Computer: Financial Overview (2025)
Figure 31 Schneider Electric Se: Financial Overview (2024)
Figure 32 Vertiv Holdings Co.: Financial Overview (2025)
Figure 33 Hewlett Packard Enterprise: Financial Overview (2025)
Figure 34 Arista Networks, Inc.: Financial Overview (2025)
Figure 35 NTT Data: Financial Overview (2024)
Figure 36 Accenture Plc: Financial Overview (2025)
Figure 37 Kyndryl Holdings, Inc.: Financial Overview (2025)


Published Date: Apr-2026
Published Date: Apr-2026
Published Date: Feb-2026
Published Date: Feb-2026
Subscribe to get the latest industry updates