Resources
About Us
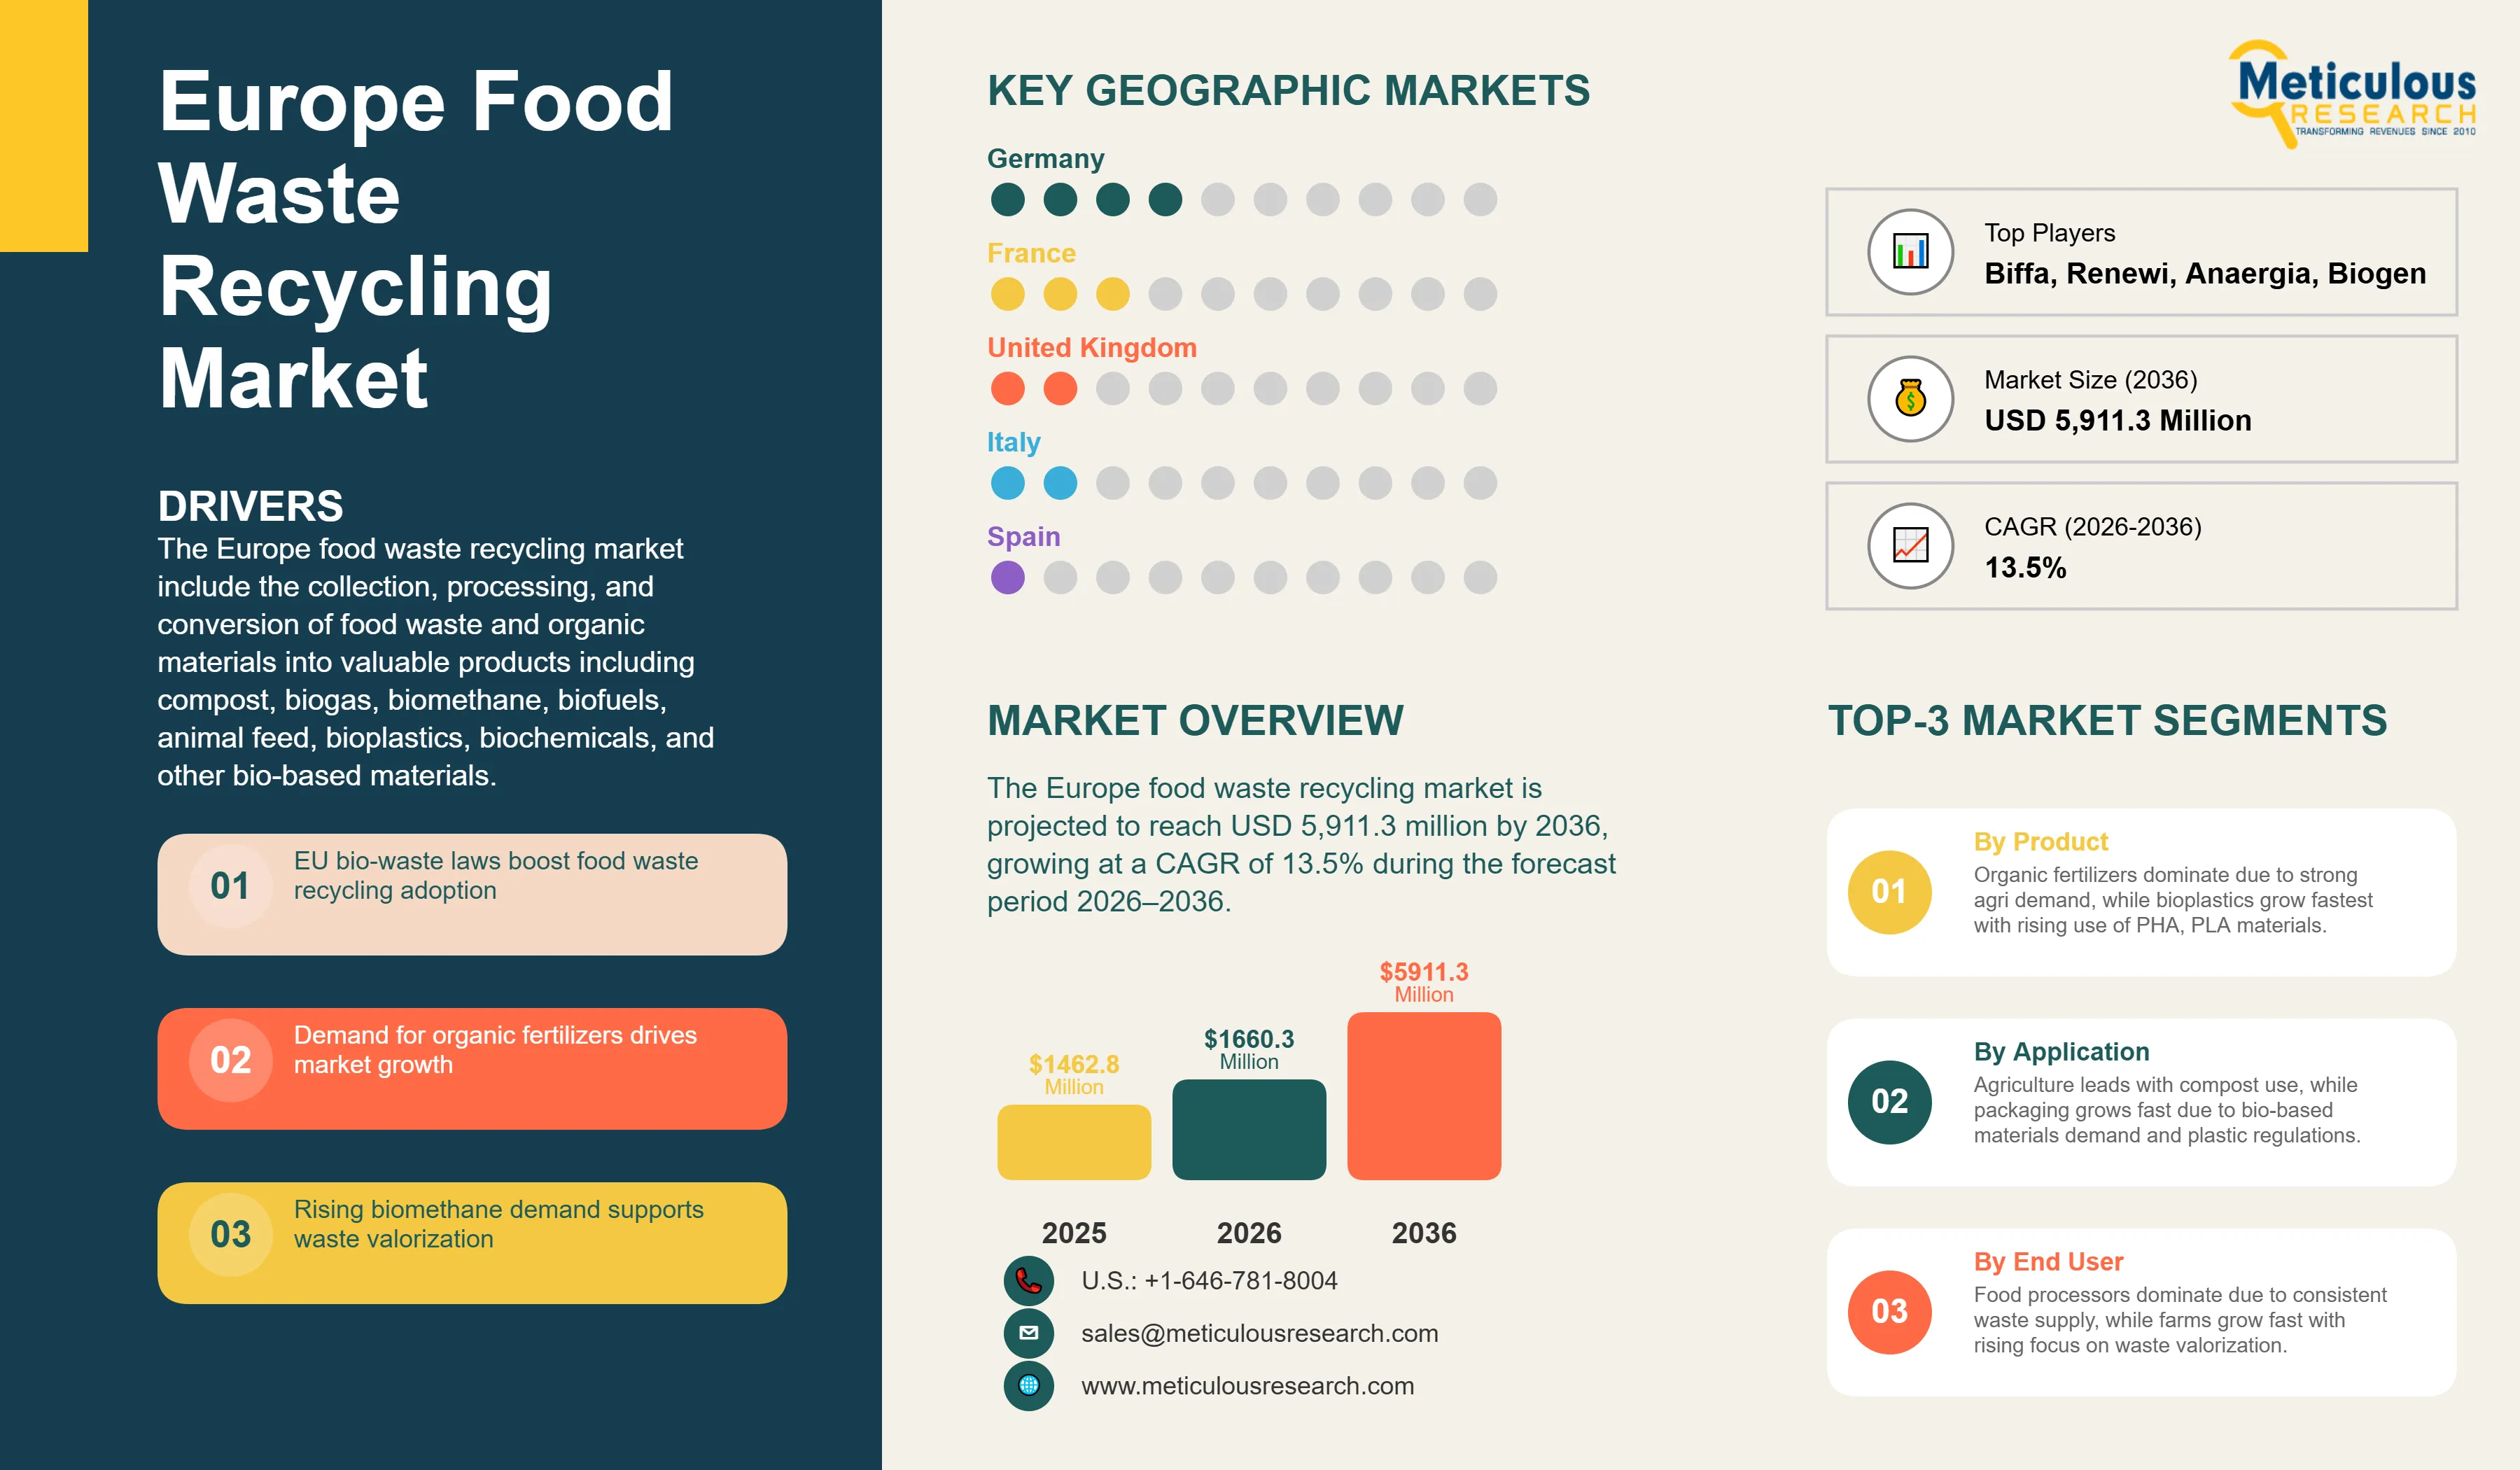
The Europe food waste recycling market was valued at USD 1,660.3 million in 2026 and is projected to reach USD 5,911.3 million by 2036, growing at a CAGR of 13.5% during the forecast period 2026–2036.
Click here to: Get Free Sample Pages of this Report
The Europe food waste recycling market include the collection, processing, and conversion of food waste and organic materials into valuable products including compost, biogas, biomethane, biofuels, animal feed, bioplastics, biochemicals, and other bio-based materials. These products are generated through a range of treatment methods including anaerobic digestion, composting, fermentation, hydrothermal processing, and integrated biorefinery approaches. With Europe generating an estimated 58 to 60 million tonnes of food waste annually across all sectors of the food supply chain, the recycling infrastructure plays a vital role in diverting organic materials from landfills, reducing methane emissions, recovering valuable nutrients, and contributing to renewable energy production in alignment with the European Green Deal and Waste Framework Directive requirements.
Food waste recycling has been a key component in Europe circular economy strategy, solving environmental concerns related to greenhouse gas emissions from landfills, resource depletion, and sustainable waste management. The sector processes organic waste generated at every stage of the food supply chain, from agricultural production and food processing to retail, hospitality, and household consumption. Advanced processing technologies transform this organic waste into renewable energy in the form of biogas and biomethane, nutrient-rich fertilizers and soil amendments, and a growing range of value-added chemical and material products, supporting the region's ambitious sustainability targets.
The growth of the food waste recycling market in Europe is primarily driven by the mandatory bio-waste separate collection obligations introduced under the revised EU Waste Framework Directive, the European Green Deal's climate neutrality and circular economy commitments that elevate food waste valorization as a strategic policy priority, and the accelerating demand for domestically produced organic fertilizers, biomethane, and bio-based materials that can be derived from recycled food waste streams across European member states. Furthermore, the rising deployment of Extended Producer Responsibility schemes and the growing commercial appetite for carbon credit monetization linked to methane avoidance and biogenic carbon sequestration are reinforcing market expansion.
However, the growth of this market is restrained by the high capital investment requirements for advanced food waste processing infrastructure, challenges of feedstock contamination and quality inconsistency that affect output of product quality, and the complexity of achieving regulatory compliance across 27 divergent national waste management legislative frameworks.
The development of integrated biorefinery models capable of generating high-value chemical outputs from food waste feedstocks, the growing monetization potential of carbon credits, and the significant export potential for European food waste processing technology to emerging markets represent substantial growth opportunities for market participants. Seasonal variability in feedstock composition and availability, persistent public acceptance and NIMBY concerns around processing facility siting, and a growing shortage of skilled workforce capable of operating advanced food waste valorization technologies remain the key challenges facing the industry.
EU Regulatory Framework and Circular Economy Policies Drive Market Transformation
The European food waste recycling market is largely defined by EU legislation that outlines mandatory requirements and provides economic incentives to divert waste from landfills. In particular, the Waste Framework Directive has targets which require member states to recycle 65% municipal waste by 2030 and reduce landfilling to a maximum of 10% by 2035. With fines of EUR 1 million per day for non-compliance, member states are under pressure to develop their organic waste processing infrastructure immediately. The requirement for the mandatory separation of bio-waste by December 2023, impacts 150 million households in the EU, which will increase source-separated food waste collection by 60%. This will also provide recycling facilities with a consistent contamination-free feedstock.
The Renewable Energy Directive (RED III) mandates a minimum target of 42.5% renewable energy in the EU by 2030 and specifies food waste-derived biogas and biomethane as important sources. Biogas and biomethane derived from food waste achieves between 80-90% greenhouse gas savings over natural gas and provides a highly sustainable source of energy. Various regulatory frameworks, converging on biogas and biomethane derived from food waste are emerging around Europe. France’s anti-waste law prohibits food waste from being destroyed, while Italy provides biowaste collection for around 7.1 million tonnes of organic waste each year, and Germany’s cascade utilisation preference encourages full material recovery and utilisation. Under the EU Taxonomy Regulations, recycling food waste is considered a sustainable economic activity, allowing for green financing and capital raising with extralow interest rates, in many cases 1-2% lower. There is anticipation that these combined voting and regulatory frameworks could attract around EUR 20 billion in private sector investment on food waste recycling and food waste related activities by 2030.
Rising Demand for Sustainable Products Creates Market Pull for Food Waste Derivatives
The growing consumer awareness and commitment to corporate sustainability has begun to drive vast demand for food waste products, including fertilizers, biobased surfactants, Biolubricants and biobased plastics and so on, taking food processing waste processors and turning them into sustainable materials & chemicals suppliers. The public would pay 20-30% more for food waste-derived organic fertilizers than conventional fertilizers. Various retailers, including Carrefour, Tesco and REWE have committed to NO food waste sent to landfill (in total they invested EUR 2 billion in recycling infrastructure), providing guaranteed feedstocks through long-term contracts.
The European bioplastics market is expected to reach between 1.5 and 2 million tonnes by 2030, fueling demand for food waste-based bioplastics such as PHA and PLA. Leading global brands like Nestlé and Unilever are actively reducing waste, committing to 100% recyclable or bio-based packaging, and securing offtake agreements worth hundreds of millions of euros annually, including around EUR 500 million per year.
Integrated Biorefinery Models Unlocking High-Value Output from Food Waste Streams
The shift toward integrated biorefinery methods is one of the most significant changes currently affecting the food waste recycling industry in Europe. Unlike traditional recycling methods that produce limited outputs like compost or biogas, biorefineries can convert food waste into a wide variety of products. These include bio based chemicals, bioplastics, enzymes, specialty ingredients, and platform chemicals. This process greatly increases the value gained from each tonne of organic material processed.
Increasing investments in processing technologies and a rising demand for sustainable materials in the chemical, packaging, and pharmaceutical sectors are speeding up the adoption of integrated biorefinery models in Europe. Although these systems are still in the early stages of commercialization, they offer much higher profit margins and greater product variety compared to traditional biological treatment methods. This makes them appealing for future investment, especially as technology improves and production scales up.
This trend fits well with European policy goals in the Circular Economy Action Plan and the EU Bioeconomy Strategy. Both emphasize the high-value use of bio-based waste over lower-end disposal or energy recovery. As a result, biorefinery processing is likely to become a more significant part of the European food waste recycling landscape in the coming years.
Digitalization and AI-Powered Optimization Enhancing Operational Efficiency
The increasing adoption of digital technologies and artificial intelligence across food waste processing operations is emerging as a meaningful trend within the recycling industry in Europe. The facility operators are progressively deploying sensor based monitoring, predictive analytics, and machine learning tools to optimize feedstock intake scheduling, improve process control in anaerobic digestion and composting operations, and enhance output quality consistency. These technologies are helping operators to manage the inherent variability of food waste feedstocks more effectively, reduce operational downtime, and improve overall resource recovery rates.
Furthermore, blockchain based traceability platforms are also gaining traction for certifying the origin, processing pathway, and end use compliance of recycled products such as digestate and compost, providing food manufacturers and agricultural buyers with greater assurance of product safety and regulatory conformity. As European regulations become more stringent and buyers increasingly demand greater transparency across supply chains, digital traceability infrastructure is expected to play a significantly larger role in supporting market access for recycled products.
Biomethane Gaining Commercial Momentum as a Strategically Important Renewable Gas
The commercial development of biomethane as a domestically produced renewable gas is gaining considerable momentum across Europe, driven by the ambitious targets under the revised Renewable Energy Directive in Europe and the broader push to reduce dependence on imported fossil gas. Food waste is one of the most productive feedstocks for biomethane production through anaerobic digestion and gas upgrading, and the combination of guaranteed feed in premiums, renewable gas certification revenues, and carbon savings is significantly improving the investment economy of biomethane projects across the region.
Countries such as Germany, France, Denmark, and the Netherlands have well established biomethane industries, while emerging markets across Southern and Eastern Europe are investing heavily in capacity expansion supported by national renewable energy incentives and EU funding programs. Using biomethane made from food waste in gas grids and as a low emission transport fuel is expanding its commercial use and strengthening its long term importance in the food waste recycling sector.
|
Parameters |
Details |
|
Market Size by 2036 |
USD 5,911.3 Million |
|
Market Size in 2026 |
USD 1,660.3 Million |
|
Revenue Growth Rate (2026–2036) |
CAGR of 13.5% |
|
Dominating Byproduct |
Organic Fertilizers |
|
Fastest Growing Byproduct |
Bioplastics |
|
Dominating Feedstock Source |
Food Processing Industry |
|
Fastest Growing Feedstock Source |
Agricultural Waste & Post-Harvest Losses |
|
Dominating Recycling Method |
Biological Methods |
|
Fastest Growing Recycling Method |
Integrated Biorefinery |
|
Dominating End Use Application |
Agriculture & Horticulture |
|
Fastest Growing End Use Application |
Packaging Industry |
|
Dominating Geography |
Western Europe |
|
Fastest Growing Geography |
Eastern Europe |
|
Base Year |
2025 |
|
Forecast Period |
2026 to 2036 |
Based on byproduct, the Europe food waste recycling market is segmented into organic fertilizers, biofuels, animal feed, biochemicals and high-value products, and bioplastics. The large share of this segment is mainly attributable to its direct alignment with circular economy principles and widespread applicability in agriculture. A significant portion of food waste is processed through composting and anaerobic digestion, producing compost and digestate that are readily used as soil amendments. The strong policy push under the European Green Deal, Farm to Fork Strategy, and restrictions on synthetic fertilizers have accelerated the adoption of organic fertilizers across the region. Additionally, the well-established infrastructure for composting and biogas plants ensures large-scale conversion of food waste into fertilizers, making this segment both commercially viable and operationally mature.
However, the bioplastics segment is projected to register the highest growth rate during the forecast period. The strong growth of this segment is mainly driven by increasing demand for sustainable alternatives to conventional plastics, rising regulatory pressure to reduce plastic waste, and the growing traction of bio based polymers such as PHA and PLA in packaging applications where single-use plastic regulations are becoming progressively stricter. Rapid advancements in biorefinery technologies, increasing investments in bio-based materials, and growing adoption by packaging and consumer goods industries are further supporting expansion of this segment over the forecast period.
By Feedstock Source: In 2026, the Food Processing Industry Segment to Hold the Largest Share
Based on feedstock source, the Europe food waste recycling market is segmented into the food processing industry, household food waste, food service and hospitality, agricultural waste and post-harvest losses, and retail and supermarkets. The large share of this segment is attributed to the high volume, consistency, and quality of waste generated at centralized facilities. Unlike household or retail waste, food processing waste is typically homogeneous, less contaminated, and produced in large quantities at a single location, making it highly suitable for efficient collection and large-scale recycling processes such as anaerobic digestion, fermentation, and biorefinery applications. The predictable supply and lower handling costs associated with processing waste make this segment the most commercially attractive and operationally efficient feedstock source in the market.
However, the agricultural waste and post-harvest losses segment is projected to register the highest growth rate during the forecast period. The strong growth of this segment is driven by increasing efforts to valorize upstream food losses, improve resource efficiency in agriculture, and capitalize on the significant volume of crop residues, unsold produce, and post-harvest spoilage generated at the primary production stage. Advances in decentralized processing technologies, improved logistics for biomass collection, and growing investments in rural biorefineries are further enabling the conversion of agricultural waste into value-added products.
By Recycling Method: In 2026, the Biological Methods Segment to Account for the Largest Share
Based on recycling method, the Europe food waste recycling market is segmented into biological methods, integrated biorefinery methods, and thermochemical methods. The leading position of this segment attributed to the technological maturity, cost effectiveness, and strong policy alignment of anaerobic digestion and composting processes, which are widely deployed across Europe, supported by well established infrastructure and regulatory backing under the Waste Framework Directive. These methods are highly suitable for handling wet and biodegradable food waste and are relatively simple to operate, scalable, and economically viable, making them the preferred treatment choice for municipalities, food processors, and waste management companies.
However, the integrated biorefinery segment is projected to register the highest growth rate during the forecast period, driven by its ability to generate a wider range of high value products and maximize resource efficiency from food waste feedstocks. Although still at a relatively early stage of commercialization, integrated biorefinery systems offer higher margins and diversification opportunities, and increasing investments in advanced processing technologies and the broader shift toward a circular bioeconomy are expected to increase their adoption during the forecast period.
By End Use Application: In 2026, the Agriculture & Horticulture Segment to Hold the Largest Share
Based on end use application, the Europe food waste recycling market is segmented into agriculture and horticulture, energy generation, animal nutrition, chemical industry, packaging industry, pharma and cosmetics, and other applications. The large share of this segment attributed to the direct and large scale utilization of recycled outputs such as compost and digestate as organic fertilizers and soil conditioners in European farming operations. The strong policy push under the European Green Deal and Farm to Fork Strategy, which promotes sustainable farming and reduced reliance on synthetic fertilizers, has further accelerated demand for organic soil inputs. Furthermore, the agriculture sector offers a stable and high volume outlet for recycled products, making it the most established and commercially viable end-use segment in the market.
However, the packaging industry segment is projected to register the highest growth rate during the forecast period, driven by increasing demand for sustainable and bio based materials as alternatives to conventional plastics, stringent European regulations on single-use plastics, and growing investments by packaging and consumer goods companies in circular materials derived from food waste feedstocks.
Based on geography, the Europe food waste recycling market is assessed across Western Europe, Southern Europe, Northern Europe, and Eastern Europe. The leading position of Western Europe is attributed to the advanced and long established bio waste separate collection infrastructure across Germany, France, the United Kingdom, the Netherlands, Belgium, and Austria; the high density of anaerobic digestion and composting processing facilities serving these markets; and the commercially advanced state of domestic markets for organic fertilizer, biomethane, and food waste derived byproducts. The regulatory maturity of national waste management frameworks in these countries, which have progressively enforced mandatory bio-waste separation and valorization requirements over multiple decades, further underpins Western Europe's market leadership.
However, Eastern Europe is expected to register the highest growth rate during the forecast period. The rapid growth of this region is primarily driven by EU compliance pressure for mandatory bio waste separate collection across Romania, Poland, Hungary, and other member states where collection and processing infrastructure development remains considerably behind the Waste Framework Directive's requirements, creating mandatory investment stimulus for processing capacity development supported by EU cohesion fund co-financing.
The competitive landscape of the Europe food waste recycling market is shaped by the scale of processing capacity, technological capability, geographic coverage, and the ability to generate certified, commercially marketable output products across diverse end use sectors. Companies with vertically integrated operations spanning feedstock collection, processing, and product offtake agreements hold a structural competitive advantage in this market.
Veolia Environment S.A. and SUEZ S.A. maintain leading positions as large scale integrated waste management operators with extensive food waste collection, processing, and valorization capabilities across multiple European geographies. Renewi plc and Biffa plc hold strong regional positions in the Netherlands, Belgium, and the United Kingdom through their well-developed organic waste treatment and resource recovery operations. FCC Environment and PreZero International represent significant players in Southern and Central European markets respectively, with growing investments in biological treatment and energy recovery infrastructure.
In the biogas and biomethane segment, specialized technology companies including BTS Biogas, WELTEC BIOPOWER, EnviTec Biogas, and Xergi A/S are driving innovation in high-performance anaerobic digestion plant design and operation. Nature Energy, now part of Shell, represents a strategically important player in the commercialization of food waste derived biomethane as a grid-injectable renewable gas in Northern Europe. Emerging companies such as Better Origin, Enterra Feed Corporation, and Paques Biomaterials are advancing novel valorization routes including insect protein production and high-value bio-based material extraction.
Some of the key players operating in the Europe food waste recycling market include Veolia Environment S.A. (France), SUEZ S.A. (France), Biffa plc (UK), Renewi plc (Netherlands/UK), FCC Environment (Spain), PreZero International (Germany), Anaergia Inc. (Canada/Italy), BTS Biogas Srl/GmbH (Italy/Germany), WELTEC BIOPOWER GmbH (Germany), EnviTec Biogas AG (Germany), Biogen (UK) Ltd., Agrivert Ltd. (UK), HZI International (Switzerland), Xergi A/S (Denmark), Nature Energy (Shell) (Denmark), Paques Biomaterials B.V. (Netherlands), Better Origin Ltd. (UK), Enterra Feed Corporation (Canada/Europe), and ReFood UK Ltd. (UK/Germany), among others.
The Europe food waste recycling market is expected to reach USD 5,911.3 million by 2036 from an estimated USD 1,660.3 million in 2026, at a CAGR of 13.5% during the forecast period 2026–2036.
In 2026, the organic fertilizers segment is expected to hold the largest share of the Europe food waste recycling market, driven by the widespread use of compost and digestate in European agriculture and strong policy alignment with the European Green Deal and Farm to Fork Strategy.
The bioplastics segment is expected to register the highest CAGR during the forecast period 2026–2036, driven by increasing demand for sustainable packaging materials, stricter single-use plastic regulations across Europe, and the growing adoption of food waste as a feedstock for bio-based polymers such as PHA and PLA.
In 2026, the food processing industry segment is expected to hold the largest share of the Europe food waste recycling market, owing to the high volume, consistency, and commercial suitability of centrally generated processing waste.
In 2026, the biological methods segment is expected to hold the largest share of the Europe food waste recycling market, reflecting the technological maturity and wide deployment of anaerobic digestion and composting processes across the region.
In 2026, the agriculture and horticulture segment is expected to hold the largest share of the Europe food waste recycling market, driven by the large-scale application of compost and digestate as organic soil inputs across European farming.
The growth of this market is primarily driven by mandatory bio-waste separate collection obligations under the revised EU Waste Framework Directive, the European Green Deal's circular economy and climate neutrality commitments, accelerating demand for domestically produced organic fertilizers and biomethane, and the expanding commercial viability of biorefinery-based high-value product recovery from food waste streams.
Key players operating in the Europe food waste recycling market include Veolia Environment S.A. (France), SUEZ S.A. (France), Biffa plc (UK), Renewi plc (Netherlands/UK), FCC Environment (Spain), PreZero International (Germany), Anaergia Inc. (Canada/Italy), BTS Biogas Srl/GmbH (Italy/Germany), WELTEC BIOPOWER GmbH (Germany), EnviTec Biogas AG (Germany), Biogen (UK) Ltd., Agrivert Ltd. (UK), HZI International (Switzerland), Xergi A/S (Denmark), Nature Energy (Shell) (Denmark), Paques Biomaterials B.V. (Netherlands), Better Origin Ltd. (UK), Enterra Feed Corporation (Canada/Europe), and ReFood UK Ltd. (UK/Germany).
Eastern Europe is expected to register the highest growth rate in the Europe food waste recycling market during the forecast period 2026–2036, driven by mandatory EU compliance investment in bio-waste collection and processing infrastructure across Romania, Poland, Hungary, and other member states supported by EU cohesion fund co-financing.
1. Market Definition & Scope
1.1. Market Definition
1.2. Market Ecosystem
1.3. Currency
1.4. Key Stakeholders
2. Research Methodology
2.1. Research Approach
2.2. Data Collection & Validation
2.2.1. Secondary Research
2.2.2. Primary Research
2.3. Market Assessment
2.3.1. Market Size Estimation
2.3.2. Bottom-Up Approach
2.3.3. Top-Down Approach
2.3.4. Growth Forecast
2.4. Assumptions For The Study
3. Executive Summary
4. Market Insights
4.1. Overview
4.2. Europe Food Waste Recycling Market: Impact Analysis Of Market Drivers (2026–2036)
4.2.1. Eu Waste Framework Directive And Mandatory Bio-Waste Separation
4.2.2. European Green Deal And Climate Neutrality Targets
4.2.3. Circular Economy Action Plan Implementation
4.2.4. Rising Demand For Organic Fertilizers And Renewable Energy
4.2.5. Extended Producer Responsibility Schemes Expansion
4.3. Europe Food Waste Recycling Market: Impact Analysis Of Market Restraints (2026–2036)
4.3.1. High Capital Investment For Processing Facilities
4.3.2. Feedstock Contamination And Quality Inconsistency
4.3.3. Complex Regulatory Compliance Across Member States
4.3.4. Competition For Feedstock With Other Valorization Routes
4.4. Europe Food Waste Recycling Market: Impact Analysis Of Market Opportunities (2026–2036)
4.4.1. Biorefinery Development For High-Value Chemicals
4.4.2. Integration With Renewable Energy Systems
4.4.3. Carbon Credit Monetization Opportunities
4.4.4. Export Potential For Technology And Products
4.5. Europe Food Waste Recycling Market: Impact Analysis Of Market Trends (2026–2036)
4.5.1. Decentralized Processing And Urban Biorefinery Models
4.5.2. Digitalization And Ai-Powered Optimization
4.5.3. Insect Farming Integration For Protein Production
4.5.4. Blockchain For Waste Traceability And Certification
4.6. Europe Food Waste Recycling Market: Impact Analysis Of Market Challenges (2026–2036)
4.6.1. Seasonal Variability In Feedstock Composition
4.6.2. Public Acceptance And Nimby Concerns
4.6.3. Skilled Workforce Shortage For Advanced Technologies
4.7. Porter's Five Forces Analysis
4.7.1. Bargaining Power Of Suppliers
4.7.2. Bargaining Power Of Buyers
4.7.3. Threat Of Substitutes
4.7.4. Threat Of New Entrants
4.7.5. Degree Of Competition
4.8. Regulatory Impact On Europe Food Waste Recycling Market
4.8.1. Eu Legislation And Directives
4.8.2. Waste Framework Directive Targets And Implementation
4.8.3. Renewable Energy Directive And Biomethane Targets
4.8.4. Landfill Directive Restrictions
4.8.5. National Implementation Variations
4.8.5.1. Member State Recycling Targets And Timelines
4.8.5.2. Support Mechanisms And Subsidies
4.8.5.3. Quality Standards And Certification Schemes
4.8.6. Future Regulatory Evolution
4.8.6.1. Potential Mandatory Food Waste Reduction Targets
4.8.6.2. Carbon Border Adjustment Implications
4.8.6.3. Sustainable Finance Taxonomy Alignment
5. Impact Of Sustainability On Europe Food Waste Recycling Market
5.1. Greenhouse Gas Emission Reduction Through Methane Avoidance
5.2. Contribution To Eu Climate Neutrality And Carbon Targets
5.3. Soil Health Improvement Through Organic Matter Recycling
5.4. Water Resource Protection From Landfill Leachate Prevention
5.5. Biodiversity Enhancement Through Reduced Chemical Fertilizer Use
5.6. Energy Security Through Domestic Renewable Energy Production
5.7. Social Benefits Through Job Creation And Rural Development
6. Global Europe Food Waste Recycling Market, By Product Type
6.1. Overview
6.2. Organic Fertilizers
6.2.1. Compost
6.2.2. Digestate
6.2.3. Biochar
6.3. Animal Feed
6.3.1. Direct Feed
6.3.2. Insect Protein
6.3.3. Processed Animal Proteins
6.4. Biofuels
6.4.1. Biogas/Biomethane
6.4.2. Bioethanol
6.4.3. Biodiesel
6.5. Bioplastics
6.5.1. Pha (Polyhydroxyalkanoates)
6.5.2. Pla (Polylactic Acid)
6.5.3. Other Biopolymers
6.6. Biochemicals & High-Value Products
6.6.1. Platform Chemicals
6.6.2. Enzymes And Proteins
6.6.3. Bioactive Compounds
7. Global Europe Food Waste Recycling Market, By Feedstock Source
7.1. Overview
7.2. Household Food Waste
7.3. Food Processing Industry
7.3.1. Fruit And Vegetable Processing
7.3.2. Dairy Processing
7.3.3. Meat And Fish Processing
7.3.4. Bakery And Confectionery
7.4. Food Service And Hospitality
7.4.1. Restaurants And Catering
7.4.2. Hotels
7.4.3. Institutional Catering
7.5. Retail And Supermarkets
7.6. Agricultural And Post-Harvest Losses
8. Europe Food Waste Recycling Market, By Recycling Method
8.1. Overview
8.2. Biological Methods
8.2.1. Anaerobic Digestion
8.2.1.1. Wet Digestion
8.2.1.2. Dry Digestion
8.2.1.3. Co-Digestion
8.2.2. Composting
8.2.2.1. Aerobic Composting
8.2.2.2. Vermicomposting
8.2.2.3. In-Vessel Composting
8.2.3. Fermentation
8.3. Thermochemical Methods
8.3.1. Hydrothermal Processing
8.3.2. Pyrolysis And Gasification
8.4. Integrated Biorefinery Method
9. Europe Food Waste Recycling Market, By End-Use Application
9.1. Overview
9.2. Agriculture And Horticulture
9.3. Energy Generation
9.4. Animal Nutrition
9.5. Chemical Industry
9.6. Packaging Industry
9.7. Pharmaceutical And Cosmetics
9.8. Others
10. Europe Food Waste Recycling Market Assessment, By Geography
10.1. Overview
10.2. Western Europe
10.2.1. Germany
10.2.2. France
10.2.3. United Kingdom
10.2.4. Netherlands
10.2.5. Belgium
10.2.6. Luxembourg
10.2.7. Austria
10.2.8. Switzerland
10.2.9. Rest Of Western Europe
10.3. Southern Europe
10.3.1. Italy
10.3.2. Spain
10.3.3. Portugal
10.3.4. Greece
10.3.5. Rest Of Southern Europe
10.4. Northern Europe
10.4.1. Sweden
10.4.2. Denmark
10.4.3. Finland
10.4.4. Norway
10.4.5. Rest Of Northern Europe
10.5. Eastern Europe
10.5.1. Poland
10.5.2. Czech Republic
10.5.3. Hungary
10.5.4. Romania
10.5.5. Rest Of Eastern Europe
11. Competitive Landscape
11.1. Introduction
11.2. Competitive Benchmarking
11.3. Competitive Dashboard
11.3.1. Industry Leaders
11.3.2. Market Differentiators
11.3.3. Vanguards
11.3.4. Emerging Companies
11.4. Market Share/Position Analysis
12. Company Profiles
12.1. Veolia Environment S.A.
12.2. Suez S.A.
12.3. Biffa Plc
12.4. Renewi Plc
12.5. Fcc Environment (Fomento De Construcciones Y Contratas)
12.6. Prezero International
12.7. Anaergia Inc.
12.8. Bts Biogas Srl/Gmbh
12.9. Weltec Biopower Gmbh
12.10. Envitec Biogas Ag
12.11. Biogen (Uk) Ltd.
12.12. Agrivert Ltd.
12.13. Hzi International (Hitachi Zosen Inova)
12.14. Xergi A/S
12.15. Nature Energy (Shell)
12.16. Paques Biomaterials B.V.
12.17. Better Origin Ltd.
12.18. Entera Feed Corporation
12.19. Refood Uk Ltd.
13. Appendix
13.1. Available Customization
13.2. Related Reports
LIST OF TABLES
Table 1. Europe Food Waste Recycling Market Drivers: Impact Analysis (2026–2036)
Table 2. Europe Food Waste Recycling Market Restraints: Impact Analysis (2026–2036)
Table 3. Europe Food Waste Recycling Market Opportunities: Impact Analysis (2026–2036)
Table 4. Europe Food Waste Recycling Market Trends: Impact Analysis (2026–2036)
Table 5. Europe Food Waste Recycling Market Challenges: Impact Analysis (2026–2036)
Table 6. Europe Food Waste Recycling Market – Porter’s Five Forces Summary (2025–2026)
Table 7. Europe Food Waste Recycling Market, By Product, 2024-2036 (Usd Million)
Table 8. Europe Organic Fertilizers Market Size, By Type, 2024-2036 (Usd Million)
Table 9. Europe Organic Fertilizers Market Size, By Country/Region, 2024-2036 ($Million)
Table 10. Europe Compost Market Size, By Country/Region, 2024-2036 ($Million)
Table 11. Europe Digestate Market Size, By Country/Region, 2024-2036 ($Million)
Table 12. Europe Biochar Market Size, By Country/Region, 2024-2036 ($Million)
Table 13. Europe Animal Feed Market Size, By Type, 2024-2036 (Usd Million)
Table 14. Europe Animal Feed Market Size, By Country/Region, 2024-2036 ($Million)
Table 15. Europe Direct Feed Market Size, By Country/Region, 2024-2036 ($Million)
Table 16. Europe Organic Fertilizers Market Size, By Country/Region, 2024-2036 ($Million)
Table 17. Europe Organic Fertilizers Market Size, By Country/Region, 2024-2036 ($Million)
Table 18. Europe Biofuels Market Size, By Type, 2024-2036 (Usd Million)
Table 19. Europe Biofuels Market Size, By Country/Region, 2024-2036 ($Million)
Table 20. Europe Biogas Market Size, By Country/Region, 2024-2036 ($Million)
Table 21. Europe Bioethanol Market Size, By Country/Region, 2024-2036 ($Million)
Table 22. Europe Biodiesel Market Size, By Country/Region, 2024-2036 ($Million)
Table 23. Europe Bioplastics Market Size, By Type, 2024-2036 (Usd Million)
Table 24. Europe Bioplastics Market Size, By Country/Region, 2024-2036 ($Million)
Table 25. Europe Pha (Polyhydroxyalkanoates) Market Size, By Country/Region, 2024-2036 ($Million)
Table 26. Europe Pla (Polylactic Acid) Market Size, By Country/Region, 2024-2036 ($Million)
Table 27. Europe Other Biopolymers Market Size, By Country/Region, 2024-2036 ($Million)
Table 28. Europe Biochemicals & High-Value Products Market Size, By Type, 2024-2036 (Usd Million)
Table 29. Europe Biochemicals & High-Value Products Market Size, By Country/Region, 2024-2036 ($Million)
Table 30. Europe Platform Chemicals Market Size, By Country/Region, 2024-2036 ($Million)
Table 31. Europe Enzymes & Proteins Market Size, By Country/Region, 2024-2036 ($Million)
Table 32. Europe Bioactive Compounds Market Size, By Country/Region, 2024-2036 ($Million)
Table 33. Europe Food Waste Recycling Market Size, By Feedstock Source, 2024-2036 (Usd Million)
Table 34. Europe Household Food Waste Recycling Market Size, By Country/Region, 2024-2036 ($Million)
Table 35. Europe Food Processing Industry Waste Recycling Market Size, By Type, 2024-2036 (Usd Million)
Table 36. Europe Food Processing Industry Waste Recycling Market Size, By Country/Region, 2024-2036 ($Million)
Table 37. Europe Fruit & Vegetable Processing Waste Recycling Market Size, By Country/Region, 2024-2036 ($Million)
Table 38. Europe Dairy Processing Waste Recycling Market Size, By Country/Region, 2024-2036 ($Million)
Table 39. Europe Meat & Fish Processing Waste Recycling Market Size, By Country/Region, 2024-2036 ($Million)
Table 40. Europe Bakery & Confectionery Waste Recycling Market Size, By Country/Region, 2024-2036 ($Million)
Table 41. Europe Food Service & Hospitality Waste Recycling Market Size, By Type, 2024-2036 (Usd Million)
Table 42. Europe Food Service & Hospitality Waste Recycling Market Size, By Country/Region, 2024-2036 ($Million)
Table 43. Europe Restaurants & Catering Waste Recycling Market Size, By Country/Region, 2024-2036 ($Million)
Table 44. Europe Hotels Waste Recycling Market Size, By Country/Region, 2024-2036 ($Million)
Table 45. Europe Institutional Catering Waste Recycling Market Size, By Country/Region, 2024-2036 ($Million)
Table 46. Europe Retail & Supermarkets Waste Recycling Market Size, By Country/Region, 2024-2036 ($Million)
Table 47. Europe Agricultural and Post-Harvest Losses Waste Recycling Market Size, By Country/Region, 2024-2036 ($Million)
Table 48. Europe Food Waste Recycling Market, By Recycling Method, 2024-2036 (Usd Million)
Table 49. Europe Food Waste Recycling By Biological Methods Market Size, By Type, 2024-2036 (Usd Million)
Table 50. Europe Food Waste Recycling By Biological Methods Market Size, By Country/Region, 2024-2036 ($Million)
Table 51. Europe Food Waste Recycling By Anaerobic Digestion Market Size, By Type, 2024-2036 (Usd Million)
Table 52. Europe Food Waste Recycling By Anaerobic Digestion Market Size, By Country/Region, 2024-2036 ($Million)
Table 53. Europe Food Waste Recycling By Wet Digestion Market Size, By Country/Region, 2024-2036 ($Million)
Table 54. Europe Food Waste Recycling By Dry Digestion Market Size, By Country/Region, 2024-2036 ($Million)
Table 55. Europe Food Waste Recycling By Co-Digestion Market Size, By Country/Region, 2024-2036 ($Million)
Table 56. Europe Food Waste Recycling By Composting Market Size, By Type, 2024-2036 (Usd Million)
Table 57. Europe Food Waste Recycling By Composting Market Size, By Country/Region, 2024-2036 ($Million)
Table 58. Europe Food Waste Recycling By Aerobic Composting Market Size, By Country/Region, 2024-2036 ($Million)
Table 59. Europe Food Waste Recycling By Vermicomposting Market Size, By Country/Region, 2024-2036 ($Million)
Table 60. Europe Food Waste Recycling By In-Vessel Composting Market Size, By Country/Region, 2024-2036 ($Million)
Table 61. Europe Food Waste Recycling By Fermentation Market Size, By Type, 2024-2036 (Usd Million)
Table 62. Europe Food Waste Recycling By Fermentation Market Size, By Country/Region, 2024-2036 ($Million)
Table 63. Europe Food Waste Recycling By Solid-State Fermentation Market Size, By Country/Region, 2024-2036 ($Million)
Table 64. Europe Food Waste Recycling By Submerged Fermentation Market Size, By Country/Region, 2024-2036 ($Million)
Table 65. Europe Food Waste Recycling By Fermentation Market Size, By Type, 2024-2036 (Usd Million)
Table 66. Europe Food Waste Recycling By Thermochemical Methods Market Size, By Country/Region, 2024-2036 ($Million)
Table 67. Europe Food Waste Recycling By Hydrothermal Processing Market Size, By Country/Region, 2024-2036 ($Million)
Table 68. Europe Food Waste Recycling By Pyrolysis Market Size, By Country/Region, 2024-2036 ($Million)
Table 69. Europe Food Waste Recycling By Gasification Market Size, By Country/Region, 2024-2036 ($Million)
Table 70. Europe Food Waste Recycling By Integrated Biorefinery Market Size, By Country/Region, 2024-2036 ($Million)
Table 71. Europe Food Waste Recycling Market, By End Use Application, 2024-2036 (Usd Million)
Table 72. Europe Food Waste Recycling Market for Agriculture & Horticulture, By Country/Region, 2024-2036 ($Million)
Table 73. Europe Food Waste Recycling Market for Energy Generation, By Country/Region, 2024-2036 ($Million)
Table 74. Europe Food Waste Recycling Market for Animal Nutrition, By Country/Region, 2024-2036 ($Million)
Table 75. Europe Food Waste Recycling Market for Chemical Industry, By Country/Region, 2024-2036 ($Million
Table 76. Europe Food Waste Recycling Market for Packaging Industry, By Country/Region, 2024-2036 ($Million)
Table 77. Europe Food Waste Recycling Market for Pharma & Cosmetics, By Country/Region, 2024-2036 ($Million)
Table 78. Europe Food Waste Recycling Market for Other Applications, By Country/Region, 2024-2036 ($Million)
Table 79. Europe Food Waste Recycling Market, By Region, 2023–2035 (Usd Million)
Table 80. Western Europe: Food Waste Recycling Market, By Country, 2023–2035 (Usd Million)
Table 81. Western Europe: Food Waste Recycling Market, By Product, 2024-2036 (Usd Million)
Table 82. Western Europe: Organic Fertilizers Market Size, By Type, 2024-2036 (Usd Million)
Table 83. Western Europe: Biofuels Market Size, By Type, 2024-2036 (Usd Million)
Table 84. Western Europe: Animal Feed Market Size, By Type, 2024-2036 (Usd Million)
Table 85. Western Europe: Biochemicals & High-Value Products Market Size, By Type, 2024-2036 (Usd Million)
Table 86. Western Europe: Bioplastics Market Size, By Type, 2024-2036 (Usd Million)
Table 87. Western Europe: Food Waste Recycling Market Size, By Feedstock Source, 2024-2036 (Usd Million)
Table 88. Western Europe: Food Processing Industry Waste Recycling Market Size, By Type, 2024-2036 (Usd Million)
Table 89. Western Europe: Food Service & Hospitality Waste Recycling Market Size, By Type, 2024-2036 (Usd Million)
Table 90. Western Europe: Europe Food Waste Recycling Market, By Recycling Method, 2024-2036 (Usd Million)
Table 91. Western Europe: Food Waste Recycling By Biological Methods Market Size, By Type, 2024-2036 (Usd Million)
Table 92. Western Europe: Food Waste Recycling By Anaerobic Digestion Market Size, By Type, 2024-2036 (Usd Million)
Table 93. Western Europe: Food Waste Recycling By Composting Market Size, By Type, 2024-2036 (Usd Million)
Table 94. Western Europe: Food Waste Recycling By Fermentation Market Size, By Type, 2024-2036 (Usd Million)
Table 95. Western Europe: Food Waste Recycling Bythermochemical Methods Market Size, By Type, 2024-2036 (Usd Million)
Table 96. Western Europe: Food Waste Recycling Market, By End Use Application, 2024-2036 (Usd Million)
Table 97. Germany: Food Waste Recycling Market, By Byproduct, 2024-2036 (Usd Million)
Table 98. Germany: Organic Fertilizers Market Size, By Type, 2024-2036 (Usd Million)
Table 99. Germany: Biofuels Market Size, By Type, 2024-2036 (Usd Million)
Table 100. Germany: Animal Feed Market Size, By Type, 2024-2036 (Usd Million)
Table 101. Germany: Biochemicals & High-Value Products Market Size, By Type, 2024-2036 (Usd Million)
Table 102. Germany: Bioplastics Market Size, By Type, 2024-2036 (Usd Million)
Table 103. Germany: Food Waste Recycling Market Size, By Feedstock Source, 2024-2036 (Usd Million)
Table 104. Germany: Food Processing Industry Waste Recycling Market Size, By Type, 2024-2036 (Usd Million)
Table 105. Germany: Food Service & Hospitality Waste Recycling Market Size, By Type, 2024-2036 (Usd Million)
Table 106. Germany: Europe Food Waste Recycling Market, By Recycling Method, 2024-2036 (Usd Million)
Table 107. Germany: Food Waste Recycling By Biological Methods Market Size, By Type, 2024-2036 (Usd Million)
Table 108. Germany: Food Waste Recycling By Anaerobic Digestion Market Size, By Type, 2024-2036 (Usd Million)
Table 109. Germany: Food Waste Recycling By Composting Market Size, By Type, 2024-2036 (Usd Million)
Table 110. Germany: Food Waste Recycling By Fermentation Market Size, By Type, 2024-2036 (Usd Million)
Table 111. Germany: Food Waste Recycling Bythermochemical Methods Market Size, By Type, 2024-2036 (Usd Million)
Table 112. Germany: Food Waste Recycling Market, By End Use Application, 2024-2036 (Usd Million)
Table 113. France: Food Waste Recycling Market, By Byproduct, 2024-2036 (Usd Million)
Table 114. France: Organic Fertilizers Market Size, By Type, 2024-2036 (Usd Million)
Table 115. France: Biofuels Market Size, By Type, 2024-2036 (Usd Million)
Table 116. France: Animal Feed Market Size, By Type, 2024-2036 (Usd Million)
Table 117. France: Biochemicals & High-Value Products Market Size, By Type, 2024-2036 (Usd Million)
Table 118. France: Bioplastics Market Size, By Type, 2024-2036 (Usd Million)
Table 119. France: Food Waste Recycling Market Size, By Feedstock Source, 2024-2036 (Usd Million)
Table 120. France: Food Processing Industry Waste Recycling Market Size, By Type, 2024-2036 (Usd Million)
Table 121. France: Food Service & Hospitality Waste Recycling Market Size, By Type, 2024-2036 (Usd Million)
Table 122. France: Europe Food Waste Recycling Market, By Recycling Method, 2024-2036 (Usd Million)
Table 123. France: Food Waste Recycling By Biological Methods Market Size, By Type, 2024-2036 (Usd Million)
Table 124. France: Food Waste Recycling By Anaerobic Digestion Market Size, By Type, 2024-2036 (Usd Million)
Table 125. France: Food Waste Recycling By Composting Market Size, By Type, 2024-2036 (Usd Million)
Table 126. France: Food Waste Recycling By Fermentation Market Size, By Type, 2024-2036 (Usd Million)
Table 127. France: Food Waste Recycling Bythermochemical Methods Market Size, By Type, 2024-2036 (Usd Million)
Table 128. France: Food Waste Recycling Market, By End Use Application, 2024-2036 (Usd Million)
Table 129. U.K.: Food Waste Recycling Market, By Byproduct, 2024-2036 (Usd Million)
Table 130. U.K.: Organic Fertilizers Market Size, By Type, 2024-2036 (Usd Million)
Table 131. U.K.: Biofuels Market Size, By Type, 2024-2036 (Usd Million)
Table 132. U.K.: Animal Feed Market Size, By Type, 2024-2036 (Usd Million)
Table 133. U.K.: Biochemicals & High-Value Products Market Size, By Type, 2024-2036 (Usd Million)
Table 134. U.K.: Bioplastics Market Size, By Type, 2024-2036 (Usd Million)
Table 135. U.K.: Food Waste Recycling Market Size, By Feedstock Source, 2024-2036 (Usd Million)
Table 136. U.K.: Food Processing Industry Waste Recycling Market Size, By Type, 2024-2036 (Usd Million)
Table 137. U.K.: Food Service & Hospitality Waste Recycling Market Size, By Type, 2024-2036 (Usd Million)
Table 138. U.K.: Europe Food Waste Recycling Market, By Recycling Method, 2024-2036 (Usd Million)
Table 139. U.K.: Food Waste Recycling By Biological Methods Market Size, By Type, 2024-2036 (Usd Million)
Table 140. U.K.: Food Waste Recycling By Anaerobic Digestion Market Size, By Type, 2024-2036 (Usd Million)
Table 141. U.K.: Food Waste Recycling By Composting Market Size, By Type, 2024-2036 (Usd Million)
Table 142. U.K.: Food Waste Recycling By Fermentation Market Size, By Type, 2024-2036 (Usd Million)
Table 143. U.K.: Food Waste Recycling Bythermochemical Methods Market Size, By Type, 2024-2036 (Usd Million)
Table 144. U.K.: Food Waste Recycling Market, By End Use Application, 2024-2036 (Usd Million)
Table 145. Netherlands: Food Waste Recycling Market, By Byproduct, 2024-2036 (Usd Million)
Table 146. Netherlands: Organic Fertilizers Market Size, By Type, 2024-2036 (Usd Million)
Table 147. Netherlands: Biofuels Market Size, By Type, 2024-2036 (Usd Million)
Table 148. Netherlands: Animal Feed Market Size, By Type, 2024-2036 (Usd Million)
Table 149. Netherlands: Biochemicals & High-Value Products Market Size, By Type, 2024-2036 (Usd Million)
Table 150. Netherlands: Bioplastics Market Size, By Type, 2024-2036 (Usd Million)
Table 151. Netherlands: Food Waste Recycling Market Size, By Feedstock Source, 2024-2036 (Usd Million)
Table 152. Netherlands: Food Processing Industry Waste Recycling Market Size, By Type, 2024-2036 (Usd Million)
Table 153. Netherlands: Food Service & Hospitality Waste Recycling Market Size, By Type, 2024-2036 (Usd Million)
Table 154. Netherlands: Europe Food Waste Recycling Market, By Recycling Method, 2024-2036 (Usd Million)
Table 155. Netherlands: Food Waste Recycling By Biological Methods Market Size, By Type, 2024-2036 (Usd Million)
Table 156. Netherlands: Food Waste Recycling By Anaerobic Digestion Market Size, By Type, 2024-2036 (Usd Million)
Table 157. Netherlands: Food Waste Recycling By Composting Market Size, By Type, 2024-2036 (Usd Million)
Table 158. Netherlands: Food Waste Recycling By Fermentation Market Size, By Type, 2024-2036 (Usd Million)
Table 159. Netherlands: Food Waste Recycling Bythermochemical Methods Market Size, By Type, 2024-2036 (Usd Million)
Table 160. Netherlands: Food Waste Recycling Market, By End Use Application, 2024-2036 (Usd Million)
Table 161. Belgium: Food Waste Recycling Market, By Byproduct, 2024-2036 (Usd Million)
Table 162. Belgium: Organic Fertilizers Market Size, By Type, 2024-2036 (Usd Million)
Table 163. Belgium: Biofuels Market Size, By Type, 2024-2036 (Usd Million)
Table 164. Belgium: Animal Feed Market Size, By Type, 2024-2036 (Usd Million)
Table 165. Belgium: Biochemicals & High-Value Products Market Size, By Type, 2024-2036 (Usd Million)
Table 166. Belgium: Bioplastics Market Size, By Type, 2024-2036 (Usd Million)
Table 167. Belgium: Food Waste Recycling Market Size, By Feedstock Source, 2024-2036 (Usd Million)
Table 168. Belgium: Food Processing Industry Waste Recycling Market Size, By Type, 2024-2036 (Usd Million)
Table 169. Belgium: Food Service & Hospitality Waste Recycling Market Size, By Type, 2024-2036 (Usd Million)
Table 170. Belgium: Europe Food Waste Recycling Market, By Recycling Method, 2024-2036 (Usd Million)
Table 171. Belgium: Food Waste Recycling By Biological Methods Market Size, By Type, 2024-2036 (Usd Million)
Table 172. Belgium: Food Waste Recycling By Anaerobic Digestion Market Size, By Type, 2024-2036 (Usd Million)
Table 173. Belgium: Food Waste Recycling By Composting Market Size, By Type, 2024-2036 (Usd Million)
Table 174. Belgium: Food Waste Recycling By Fermentation Market Size, By Type, 2024-2036 (Usd Million)
Table 175. Belgium: Food Waste Recycling Bythermochemical Methods Market Size, By Type, 2024-2036 (Usd Million)
Table 176. Belgium: Food Waste Recycling Market, By End Use Application, 2024-2036 (Usd Million)
Table 177. Luxembourg: Food Waste Recycling Market, By Byproduct, 2024-2036 (Usd Million)
Table 178. Luxembourg: Organic Fertilizers Market Size, By Type, 2024-2036 (Usd Million)
Table 179. Luxembourg: Biofuels Market Size, By Type, 2024-2036 (Usd Million)
Table 180. Luxembourg: Animal Feed Market Size, By Type, 2024-2036 (Usd Million)
Table 181. Luxembourg: Biochemicals & High-Value Products Market Size, By Type, 2024-2036 (Usd Million)
Table 182. Luxembourg: Bioplastics Market Size, By Type, 2024-2036 (Usd Million)
Table 183. Luxembourg: Food Waste Recycling Market Size, By Feedstock Source, 2024-2036 (Usd Million)
Table 184. Luxembourg: Food Processing Industry Waste Recycling Market Size, By Type, 2024-2036 (Usd Million)
Table 185. Luxembourg: Food Service & Hospitality Waste Recycling Market Size, By Type, 2024-2036 (Usd Million)
Table 186. Luxembourg: Europe Food Waste Recycling Market, By Recycling Method, 2024-2036 (Usd Million)
Table 187. Luxembourg: Food Waste Recycling By Biological Methods Market Size, By Type, 2024-2036 (Usd Million)
Table 188. Luxembourg: Food Waste Recycling By Anaerobic Digestion Market Size, By Type, 2024-2036 (Usd Million)
Table 189. Luxembourg: Food Waste Recycling By Composting Market Size, By Type, 2024-2036 (Usd Million)
Table 190. Luxembourg: Food Waste Recycling By Fermentation Market Size, By Type, 2024-2036 (Usd Million)
Table 191. Luxembourg: Food Waste Recycling Bythermochemical Methods Market Size, By Type, 2024-2036 (Usd Million)
Table 192. Luxembourg: Food Waste Recycling Market, By End Use Application, 2024-2036 (Usd Million)
Table 193. Austria: Food Waste Recycling Market, By Byproduct, 2024-2036 (Usd Million)
Table 194. Austria: Organic Fertilizers Market Size, By Type, 2024-2036 (Usd Million)
Table 195. Austria: Biofuels Market Size, By Type, 2024-2036 (Usd Million)
Table 196. Austria: Animal Feed Market Size, By Type, 2024-2036 (Usd Million)
Table 197. Austria: Biochemicals & High-Value Products Market Size, By Type, 2024-2036 (Usd Million)
Table 198. Austria: Bioplastics Market Size, By Type, 2024-2036 (Usd Million)
Table 199. Austria: Food Waste Recycling Market Size, By Feedstock Source, 2024-2036 (Usd Million)
Table 200. Austria: Food Processing Industry Waste Recycling Market Size, By Type, 2024-2036 (Usd Million)
Table 201. Austria: Food Service & Hospitality Waste Recycling Market Size, By Type, 2024-2036 (Usd Million)
Table 202. Austria: Europe Food Waste Recycling Market, By Recycling Method, 2024-2036 (Usd Million)
Table 203. Austria: Food Waste Recycling By Biological Methods Market Size, By Type, 2024-2036 (Usd Million)
Table 204. Austria: Food Waste Recycling By Anaerobic Digestion Market Size, By Type, 2024-2036 (Usd Million)
Table 205. Austria: Food Waste Recycling By Composting Market Size, By Type, 2024-2036 (Usd Million)
Table 206. Austria: Food Waste Recycling By Fermentation Market Size, By Type, 2024-2036 (Usd Million)
Table 207. Austria: Food Waste Recycling Bythermochemical Methods Market Size, By Type, 2024-2036 (Usd Million)
Table 208. Austria: Food Waste Recycling Market, By End Use Application, 2024-2036 (Usd Million)
Table 209. Switzerland: Food Waste Recycling Market, By Byproduct, 2024-2036 (Usd Million)
Table 210. Switzerland: Organic Fertilizers Market Size, By Type, 2024-2036 (Usd Million)
Table 211. Switzerland: Biofuels Market Size, By Type, 2024-2036 (Usd Million)
Table 212. Switzerland: Animal Feed Market Size, By Type, 2024-2036 (Usd Million)
Table 213. Switzerland: Biochemicals & High-Value Products Market Size, By Type, 2024-2036 (Usd Million)
Table 214. Switzerland: Bioplastics Market Size, By Type, 2024-2036 (Usd Million)
Table 215. Switzerland: Food Waste Recycling Market Size, By Feedstock Source, 2024-2036 (Usd Million)
Table 216. Switzerland: Food Processing Industry Waste Recycling Market Size, By Type, 2024-2036 (Usd Million)
Table 217. Switzerland: Food Service & Hospitality Waste Recycling Market Size, By Type, 2024-2036 (Usd Million)
Table 218. Switzerland: Europe Food Waste Recycling Market, By Recycling Method, 2024-2036 (Usd Million)
Table 219. Switzerland: Food Waste Recycling By Biological Methods Market Size, By Type, 2024-2036 (Usd Million)
Table 220. Switzerland: Food Waste Recycling By Anaerobic Digestion Market Size, By Type, 2024-2036 (Usd Million)
Table 221. Switzerland: Food Waste Recycling By Composting Market Size, By Type, 2024-2036 (Usd Million)
Table 222. Switzerland: Food Waste Recycling By Fermentation Market Size, By Type, 2024-2036 (Usd Million)
Table 223. Switzerland: Food Waste Recycling Bythermochemical Methods Market Size, By Type, 2024-2036 (Usd Million)
Table 224. Switzerland: Food Waste Recycling Market, By End Use Application, 2024-2036 (Usd Million)
Table 225. Rest Of Western Europe: Food Waste Recycling Market, By Byproduct, 2024-2036 (Usd Million)
Table 226. Rest Of Western Europe: Organic Fertilizers Market Size, By Type, 2024-2036 (Usd Million)
Table 227. Rest Of Western Europe: Biofuels Market Size, By Type, 2024-2036 (Usd Million)
Table 228. Rest Of Western Europe: Animal Feed Market Size, By Type, 2024-2036 (Usd Million)
Table 229. Rest Of Western Europe: Biochemicals & High-Value Products Market Size, By Type, 2024-2036 (Usd Million)
Table 230. Rest Of Western Europe: Bioplastics Market Size, By Type, 2024-2036 (Usd Million)
Table 231. Rest Of Western Europe: Food Waste Recycling Market Size, By Feedstock Source, 2024-2036 (Usd Million)
Table 232. Rest Of Western Europe: Food Processing Industry Waste Recycling Market Size, By Type, 2024-2036 (Usd Million)
Table 233. Rest Of Western Europe: Food Service & Hospitality Waste Recycling Market Size, By Type, 2024-2036 (Usd Million)
Table 234. Rest Of Western Europe: Europe Food Waste Recycling Market, By Recycling Method, 2024-2036 (Usd Million)
Table 235. Rest Of Western Europe: Food Waste Recycling By Biological Methods Market Size, By Type, 2024-2036 (Usd Million)
Table 236. Rest Of Western Europe: Food Waste Recycling By Anaerobic Digestion Market Size, By Type, 2024-2036 (Usd Million)
Table 237. Rest Of Western Europe: Food Waste Recycling By Composting Market Size, By Type, 2024-2036 (Usd Million)
Table 238. Rest Of Western Europe: Food Waste Recycling By Fermentation Market Size, By Type, 2024-2036 (Usd Million)
Table 239. Rest Of Western Europe: Food Waste Recycling Bythermochemical Methods Market Size, By Type, 2024-2036 (Usd Million)
Table 240. Rest Of Western Europe: Food Waste Recycling Market, By End Use Application, 2024-2036 (Usd Million)
Table 241. Southern Europe: Food Waste Recycling Market, By Country, 2023–2035 (Usd Million)
Table 242. Southern Europe: Food Waste Recycling Market, By Byproduct, 2024-2036 (Usd Million)
Table 243. Southern Europe: Organic Fertilizers Market Size, By Type, 2024-2036 (Usd Million)
Table 244. Southern Europe: Biofuels Market Size, By Type, 2024-2036 (Usd Million)
Table 245. Southern Europe: Animal Feed Market Size, By Type, 2024-2036 (Usd Million)
Table 246. Southern Europe: Biochemicals & High-Value Products Market Size, By Type, 2024-2036 (Usd Million)
Table 247. Southern Europe: Bioplastics Market Size, By Type, 2024-2036 (Usd Million)
Table 248. Southern Europe: Food Waste Recycling Market Size, By Feedstock Source, 2024-2036 (Usd Million)
Table 249. Southern Europe: Food Processing Industry Waste Recycling Market Size, By Type, 2024-2036 (Usd Million)
Table 250. Southern Europe: Food Service & Hospitality Waste Recycling Market Size, By Type, 2024-2036 (Usd Million)
Table 251. Southern Europe: Europe Food Waste Recycling Market, By Recycling Method, 2024-2036 (Usd Million)
Table 252. Southern Europe: Food Waste Recycling By Biological Methods Market Size, By Type, 2024-2036 (Usd Million)
Table 253. Southern Europe: Food Waste Recycling By Anaerobic Digestion Market Size, By Type, 2024-2036 (Usd Million)
Table 254. Southern Europe: Food Waste Recycling By Composting Market Size, By Type, 2024-2036 (Usd Million)
Table 255. Southern Europe: Food Waste Recycling By Fermentation Market Size, By Type, 2024-2036 (Usd Million)
Table 256. Southern Europe: Food Waste Recycling Bythermochemical Methods Market Size, By Type, 2024-2036 (Usd Million)
Table 257. Southern Europe: Food Waste Recycling Market, By End Use Application, 2024-2036 (Usd Million)
Table 258. Italy: Food Waste Recycling Market, By Byproduct, 2024-2036 (Usd Million)
Table 259. Italy: Organic Fertilizers Market Size, By Type, 2024-2036 (Usd Million)
Table 260. Italy: Biofuels Market Size, By Type, 2024-2036 (Usd Million)
Table 261. Italy: Animal Feed Market Size, By Type, 2024-2036 (Usd Million)
Table 262. Italy: Biochemicals & High-Value Products Market Size, By Type, 2024-2036 (Usd Million)
Table 263. Italy: Bioplastics Market Size, By Type, 2024-2036 (Usd Million)
Table 264. Italy: Food Waste Recycling Market Size, By Feedstock Source, 2024-2036 (Usd Million)
Table 265. Italy: Food Processing Industry Waste Recycling Market Size, By Type, 2024-2036 (Usd Million)
Table 266. Italy: Food Service & Hospitality Waste Recycling Market Size, By Type, 2024-2036 (Usd Million)
Table 267. Italy: Europe Food Waste Recycling Market, By Recycling Method, 2024-2036 (Usd Million)
Table 268. Italy: Food Waste Recycling By Biological Methods Market Size, By Type, 2024-2036 (Usd Million)
Table 269. Italy: Food Waste Recycling By Anaerobic Digestion Market Size, By Type, 2024-2036 (Usd Million)
Table 270. Italy: Food Waste Recycling By Composting Market Size, By Type, 2024-2036 (Usd Million)
Table 271. Italy: Food Waste Recycling By Fermentation Market Size, By Type, 2024-2036 (Usd Million)
Table 272. Italy: Food Waste Recycling Bythermochemical Methods Market Size, By Type, 2024-2036 (Usd Million)
Table 273. Italy: Food Waste Recycling Market, By End Use Application, 2024-2036 (Usd Million)
Table 274. Spain: Food Waste Recycling Market, By Byproduct, 2024-2036 (Usd Million)
Table 275. Spain: Organic Fertilizers Market Size, By Type, 2024-2036 (Usd Million)
Table 276. Spain: Biofuels Market Size, By Type, 2024-2036 (Usd Million)
Table 277. Spain: Animal Feed Market Size, By Type, 2024-2036 (Usd Million)
Table 278. Spain: Biochemicals & High-Value Products Market Size, By Type, 2024-2036 (Usd Million)
Table 279. Spain: Bioplastics Market Size, By Type, 2024-2036 (Usd Million)
Table 280. Spain: Food Waste Recycling Market Size, By Feedstock Source, 2024-2036 (Usd Million)
Table 281. Spain: Food Processing Industry Waste Recycling Market Size, By Type, 2024-2036 (Usd Million)
Table 282. Spain: Food Service & Hospitality Waste Recycling Market Size, By Type, 2024-2036 (Usd Million)
Table 283. Spain: Europe Food Waste Recycling Market, By Recycling Method, 2024-2036 (Usd Million)
Table 284. Spain: Food Waste Recycling By Biological Methods Market Size, By Type, 2024-2036 (Usd Million)
Table 285. Spain: Food Waste Recycling By Anaerobic Digestion Market Size, By Type, 2024-2036 (Usd Million)
Table 286. Spain: Food Waste Recycling By Composting Market Size, By Type, 2024-2036 (Usd Million)
Table 287. Spain: Food Waste Recycling By Fermentation Market Size, By Type, 2024-2036 (Usd Million)
Table 288. Spain: Food Waste Recycling Bythermochemical Methods Market Size, By Type, 2024-2036 (Usd Million)
Table 289. Spain: Food Waste Recycling Market, By End Use Application, 2024-2036 (Usd Million)
Table 290. Portugal: Food Waste Recycling Market, By Byproduct, 2024-2036 (Usd Million)
Table 291. Portugal: Organic Fertilizers Market Size, By Type, 2024-2036 (Usd Million)
Table 292. Portugal: Biofuels Market Size, By Type, 2024-2036 (Usd Million)
Table 293. Portugal: Animal Feed Market Size, By Type, 2024-2036 (Usd Million)
Table 294. Portugal: Biochemicals & High-Value Products Market Size, By Type, 2024-2036 (Usd Million)
Table 295. Portugal: Bioplastics Market Size, By Type, 2024-2036 (Usd Million)
Table 296. Portugal: Food Waste Recycling Market Size, By Feedstock Source, 2024-2036 (Usd Million)
Table 297. Portugal: Food Processing Industry Waste Recycling Market Size, By Type, 2024-2036 (Usd Million)
Table 298. Portugal: Food Service & Hospitality Waste Recycling Market Size, By Type, 2024-2036 (Usd Million)
Table 299. Portugal: Europe Food Waste Recycling Market, By Recycling Method, 2024-2036 (Usd Million)
Table 300. Portugal: Food Waste Recycling By Biological Methods Market Size, By Type, 2024-2036 (Usd Million)
Table 301. Portugal: Food Waste Recycling By Anaerobic Digestion Market Size, By Type, 2024–2036 (Usd Million)
Table 302. Portugal: Food Waste Recycling By Composting Market Size, By Type, 2024–2036 (Usd Million)
Table 303. Portugal: Food Waste Recycling By Fermentation Market Size, By Type, 2024–2036 (Usd Million)
Table 304. Portugal: Food Waste Recycling By Thermochemical Methods Market Size, By Type, 2024–2036 (Usd Million)
Table 305. Portugal: Food Waste Recycling Market, By End Use Application, 2024–2036 (Usd Million)
Table 306. Greece: Food Waste Recycling Market, By Byproduct, 2024–2036 (Usd Million)
Table 307. Greece: Organic Fertilizers Market Size, By Type, 2024–2036 (Usd Million)
Table 308. Greece: Biofuels Market Size, By Type, 2024–2036 (Usd Million)
Table 309. Greece: Animal Feed Market Size, By Type, 2024–2036 (Usd Million)
Table 310. Greece: Biochemicals & High-Value Products Market Size, By Type, 2024–2036 (Usd Million)
Table 311. Greece: Bioplastics Market Size, By Type, 2024–2036 (Usd Million)
Table 312. Greece: Food Waste Recycling Market Size, By Feedstock Source, 2024–2036 (Usd Million)
Table 313. Greece: Food Processing Industry Waste Recycling Market Size, By Type, 2024–2036 (Usd Million)
Table 314. Greece: Food Service & Hospitality Waste Recycling Market Size, By Type, 2024–2036 (Usd Million)
Table 315. Greece: Europe Food Waste Recycling Market, By Recycling Method, 2024–2036 (Usd Million)
Table 316. Greece: Food Waste Recycling By Biological Methods Market Size, By Type, 2024–2036 (Usd Million)
Table 317. Greece: Food Waste Recycling By Anaerobic Digestion Market Size, By Type, 2024–2036 (Usd Million)
Table 318. Greece: Food Waste Recycling By Composting Market Size, By Type, 2024–2036 (Usd Million)
Table 319. Greece: Food Waste Recycling By Fermentation Market Size, By Type, 2024–2036 (Usd Million)
Table 320. Greece: Food Waste Recycling By Thermochemical Methods Market Size, By Type, 2024–2036 (Usd Million)
Table 321. Greece: Food Waste Recycling Market, By End Use Application, 2024–2036 (Usd Million)
Table 322. Rest Of Southern Europe: Food Waste Recycling Market, By Byproduct, 2024–2036 (Usd Million)
Table 323. Rest Of Southern Europe: Organic Fertilizers Market Size, By Type, 2024–2036 (Usd Million)
Table 324. Rest Of Southern Europe: Biofuels Market Size, By Type, 2024–2036 (Usd Million)
Table 325. Rest Of Southern Europe: Animal Feed Market Size, By Type, 2024–2036 (Usd Million)
Table 326. Rest Of Southern Europe: Biochemicals & High-Value Products Market Size, By Type, 2024–2036 (Usd Million)
Table 327. Rest Of Southern Europe: Bioplastics Market Size, By Type, 2024–2036 (Usd Million)
Table 328. Rest Of Southern Europe: Food Waste Recycling Market Size, By Feedstock Source, 2024–2036 (Usd Million)
Table 329. Rest Of Southern Europe: Food Processing Industry Waste Recycling Market Size, By Type, 2024–2036 (Usd Million)
Table 330. Rest Of Southern Europe: Food Service & Hospitality Waste Recycling Market Size, By Type, 2024–2036 (Usd Million)
Table 331. Rest Of Southern Europe: Europe Food Waste Recycling Market, By Recycling Method, 2024–2036 (Usd Million)
Table 332. Rest Of Southern Europe: Food Waste Recycling By Biological Methods Market Size, By Type, 2024–2036 (Usd Million)
Table 333. Rest Of Southern Europe: Food Waste Recycling By Anaerobic Digestion Market Size, By Type, 2024–2036 (Usd Million)
Table 334. Rest Of Southern Europe: Food Waste Recycling By Composting Market Size, By Type, 2024–2036 (Usd Million)
Table 335. Rest Of Southern Europe: Food Waste Recycling By Fermentation Market Size, By Type, 2024–2036 (Usd Million)
Table 336. Rest Of Southern Europe: Food Waste Recycling By Thermochemical Methods Market Size, By Type, 2024–2036 (Usd Million)
Table 337. Rest Of Southern Europe: Food Waste Recycling Market, By End Use Application, 2024–2036 (Usd Million)
Table 338. Northern Europe: Food Waste Recycling Market, By Country, 2023–2035 (Usd Million)
Table 339. Northern Europe: Food Waste Recycling Market, By Byproduct, 2024–2036 (Usd Million)
Table 340. Northern Europe: Organic Fertilizers Market Size, By Type, 2024–2036 (Usd Million)
Table 341. Northern Europe: Biofuels Market Size, By Type, 2024–2036 (Usd Million)
Table 342. Northern Europe: Animal Feed Market Size, By Type, 2024–2036 (Usd Million)
Table 343. Northern Europe: Biochemicals & High-Value Products Market Size, By Type, 2024–2036 (Usd Million)
Table 344. Northern Europe: Bioplastics Market Size, By Type, 2024–2036 (Usd Million)
Table 345. Northern Europe: Food Waste Recycling Market Size, By Feedstock Source, 2024–2036 (Usd Million)
Table 346. Northern Europe: Food Processing Industry Waste Recycling Market Size, By Type, 2024–2036 (Usd Million)
Table 347. Northern Europe: Food Service & Hospitality Waste Recycling Market Size, By Type, 2024–2036 (Usd Million)
Table 348. Northern Europe: Europe Food Waste Recycling Market, By Recycling Method, 2024–2036 (Usd Million)
Table 349. Northern Europe: Food Waste Recycling By Biological Methods Market Size, By Type, 2024–2036 (Usd Million)
Table 350. Northern Europe: Food Waste Recycling By Anaerobic Digestion Market Size, By Type, 2024–2036 (Usd Million)
Table 351. Northern Europe: Food Waste Recycling By Composting Market Size, By Type, 2024–2036 (Usd Million)
Table 352. Northern Europe: Food Waste Recycling By Fermentation Market Size, By Type, 2024–2036 (Usd Million)
Table 353. Northern Europe: Food Waste Recycling By Thermochemical Methods Market Size, By Type, 2024–2036 (Usd Million)
Table 354. Northern Europe: Food Waste Recycling Market, By End Use Application, 2024–2036 (Usd Million)
Table 355. Sweden: Food Waste Recycling Market, By Byproduct, 2024–2036 (Usd Million)
Table 356. Sweden: Organic Fertilizers Market Size, By Type, 2024–2036 (Usd Million)
Table 357. Sweden: Biofuels Market Size, By Type, 2024–2036 (Usd Million)
Table 358. Sweden: Animal Feed Market Size, By Type, 2024–2036 (Usd Million)
Table 359. Sweden: Biochemicals & High-Value Products Market Size, By Type, 2024–2036 (Usd Million)
Table 360. Sweden: Bioplastics Market Size, By Type, 2024–2036 (Usd Million)
Table 361. Sweden: Food Waste Recycling Market Size, By Feedstock Source, 2024–2036 (Usd Million)
Table 362. Sweden: Food Processing Industry Waste Recycling Market Size, By Type, 2024–2036 (Usd Million)
Table 363. Sweden: Food Service & Hospitality Waste Recycling Market Size, By Type, 2024–2036 (Usd Million)
Table 364. Sweden: Europe Food Waste Recycling Market, By Recycling Method, 2024–2036 (Usd Million)
Table 365. Sweden: Food Waste Recycling By Biological Methods Market Size, By Type, 2024–2036 (Usd Million)
Table 366. Sweden: Food Waste Recycling By Anaerobic Digestion Market Size, By Type, 2024–2036 (Usd Million)
Table 367. Sweden: Food Waste Recycling By Composting Market Size, By Type, 2024–2036 (Usd Million)
Table 368. Sweden: Food Waste Recycling By Fermentation Market Size, By Type, 2024–2036 (Usd Million)
Table 369. Sweden: Food Waste Recycling By Thermochemical Methods Market Size, By Type, 2024–2036 (Usd Million)
Table 370. Sweden: Food Waste Recycling Market, By End Use Application, 2024–2036 (Usd Million)
Table 371. Denmark: Food Waste Recycling Market, By Byproduct, 2024–2036 (Usd Million)
Table 372. Denmark: Organic Fertilizers Market Size, By Type, 2024–2036 (Usd Million)
Table 373. Denmark: Biofuels Market Size, By Type, 2024–2036 (Usd Million)
Table 374. Denmark: Animal Feed Market Size, By Type, 2024–2036 (Usd Million)
Table 375. Denmark: Biochemicals & High-Value Products Market Size, By Type, 2024–2036 (Usd Million)
Table 376. Denmark: Bioplastics Market Size, By Type, 2024–2036 (Usd Million)
Table 377. Denmark: Food Waste Recycling Market Size, By Feedstock Source, 2024–2036 (Usd Million)
Table 378. Denmark: Food Processing Industry Waste Recycling Market Size, By Type, 2024–2036 (Usd Million)
Table 379. Denmark: Food Service & Hospitality Waste Recycling Market Size, By Type, 2024–2036 (Usd Million)
Table 380. Denmark: Europe Food Waste Recycling Market, By Recycling Method, 2024–2036 (Usd Million)
Table 381. Denmark: Food Waste Recycling By Biological Methods Market Size, By Type, 2024–2036 (Usd Million)
Table 382. Denmark: Food Waste Recycling By Anaerobic Digestion Market Size, By Type, 2024–2036 (Usd Million)
Table 383. Denmark: Food Waste Recycling By Composting Market Size, By Type, 2024–2036 (Usd Million)
Table 384. Denmark: Food Waste Recycling By Fermentation Market Size, By Type, 2024–2036 (Usd Million)
Table 385. Denmark: Food Waste Recycling By Thermochemical Methods Market Size, By Type, 2024–2036 (Usd Million)
Table 386. Denmark: Food Waste Recycling Market, By End Use Application, 2024–2036 (Usd Million)
Table 387. Finland: Food Waste Recycling Market, By Byproduct, 2024–2036 (Usd Million)
Table 388. Finland: Organic Fertilizers Market Size, By Type, 2024–2036 (Usd Million)
Table 389. Finland: Biofuels Market Size, By Type, 2024–2036 (Usd Million)
Table 390. Finland: Animal Feed Market Size, By Type, 2024–2036 (Usd Million)
Table 391. Finland: Biochemicals & High-Value Products Market Size, By Type, 2024–2036 (Usd Million)
Table 392. Finland: Bioplastics Market Size, By Type, 2024–2036 (Usd Million)
Table 393. Finland: Food Waste Recycling Market Size, By Feedstock Source, 2024–2036 (Usd Million)
Table 394. Finland: Food Processing Industry Waste Recycling Market Size, By Type, 2024–2036 (Usd Million)
Table 395. Finland: Food Service & Hospitality Waste Recycling Market Size, By Type, 2024–2036 (Usd Million)
Table 396. Finland: Europe Food Waste Recycling Market, By Recycling Method, 2024–2036 (Usd Million)
Table 397. Finland: Food Waste Recycling By Biological Methods Market Size, By Type, 2024–2036 (Usd Million)
Table 398. Finland: Food Waste Recycling By Anaerobic Digestion Market Size, By Type, 2024–2036 (Usd Million)
Table 399. Finland: Food Waste Recycling By Composting Market Size, By Type, 2024–2036 (Usd Million)
Table 400. Finland: Food Waste Recycling By Fermentation Market Size, By Type, 2024–2036 (Usd Million)
Table 401. Finland: Food Waste Recycling By Thermochemical Methods Market Size, By Type, 2024–2036 (Usd Million)
Table 402. Finland: Food Waste Recycling Market, By End Use Application, 2024–2036 (Usd Million)
Table 403. Norway: Food Waste Recycling Market, By Byproduct, 2024–2036 (Usd Million)
Table 404. Norway: Organic Fertilizers Market Size, By Type, 2024–2036 (Usd Million)
Table 405. Norway: Biofuels Market Size, By Type, 2024–2036 (Usd Million)
Table 406. Norway: Animal Feed Market Size, By Type, 2024–2036 (Usd Million)
Table 407. Norway: Biochemicals & High-Value Products Market Size, By Type, 2024–2036 (Usd Million)
Table 408. Norway: Bioplastics Market Size, By Type, 2024–2036 (Usd Million)
Table 409. Norway: Food Waste Recycling Market Size, By Feedstock Source, 2024–2036 (Usd Million)
Table 410. Norway: Food Processing Industry Waste Recycling Market Size, By Type, 2024–2036 (Usd Million)
Table 411. Norway: Food Service & Hospitality Waste Recycling Market Size, By Type, 2024–2036 (Usd Million)
Table 412. Norway: Europe Food Waste Recycling Market, By Recycling Method, 2024–2036 (Usd Million)
Table 413. Norway: Food Waste Recycling By Biological Methods Market Size, By Type, 2024–2036 (Usd Million)
Table 414. Norway: Food Waste Recycling By Anaerobic Digestion Market Size, By Type, 2024–2036 (Usd Million)
Table 415. Norway: Food Waste Recycling By Composting Market Size, By Type, 2024–2036 (Usd Million)
Table 416. Norway: Food Waste Recycling By Fermentation Market Size, By Type, 2024–2036 (Usd Million)
Table 417. Norway: Food Waste Recycling By Thermochemical Methods Market Size, By Type, 2024–2036 (Usd Million)
Table 418. Norway: Food Waste Recycling Market, By End Use Application, 2024–2036 (Usd Million)
Table 419. Rest Of Northern Europe: Food Waste Recycling Market, By Byproduct, 2024–2036 (Usd Million)
Table 420. Rest Of Northern Europe: Organic Fertilizers Market Size, By Type, 2024–2036 (Usd Million)
Table 421. Rest Of Northern Europe: Biofuels Market Size, By Type, 2024–2036 (Usd Million)
Table 422. Rest Of Northern Europe: Animal Feed Market Size, By Type, 2024–2036 (Usd Million)
Table 423. Rest Of Northern Europe: Biochemicals & High-Value Products Market Size, By Type, 2024–2036 (Usd Million)
Table 424. Rest Of Northern Europe: Bioplastics Market Size, By Type, 2024–2036 (Usd Million)
Table 425. Rest Of Northern Europe: Food Waste Recycling Market Size, By Feedstock Source, 2024–2036 (Usd Million)
Table 426. Rest Of Northern Europe: Food Processing Industry Waste Recycling Market Size, By Type, 2024–2036 (Usd Million)
Table 427. Rest Of Northern Europe: Food Service & Hospitality Waste Recycling Market Size, By Type, 2024–2036 (Usd Million)
Table 428. Rest Of Northern Europe: Europe Food Waste Recycling Market, By Recycling Method, 2024–2036 (Usd Million)
Table 429. Rest Of Northern Europe: Food Waste Recycling By Biological Methods Market Size, By Type, 2024–2036 (Usd Million)
Table 430. Rest Of Northern Europe: Food Waste Recycling By Anaerobic Digestion Market Size, By Type, 2024–2036 (Usd Million)
Table 431. Rest Of Northern Europe: Food Waste Recycling By Composting Market Size, By Type, 2024–2036 (Usd Million)
Table 432. Rest Of Northern Europe: Food Waste Recycling By Fermentation Market Size, By Type, 2024–2036 (Usd Million)
Table 433. Rest Of Northern Europe: Food Waste Recycling By Thermochemical Methods Market Size, By Type, 2024–2036 (Usd Million)
Table 434. Rest Of Northern Europe: Food Waste Recycling Market, By End Use Application, 2024–2036 (Usd Million)
Table 435. Eastern Europe: Food Waste Recycling Market, By Country, 2023–2035 (Usd Million)
Table 436. Eastern Europe: Food Waste Recycling Market, By Byproduct, 2024–2036 (Usd Million)
Table 437. Eastern Europe: Organic Fertilizers Market Size, By Type, 2024–2036 (Usd Million)
Table 438. Eastern Europe: Biofuels Market Size, By Type, 2024–2036 (Usd Million)
Table 439. Eastern Europe: Animal Feed Market Size, By Type, 2024–2036 (Usd Million)
Table 440. Eastern Europe: Biochemicals & High-Value Products Market Size, By Type, 2024–2036 (Usd Million)
Table 441. Eastern Europe: Bioplastics Market Size, By Type, 2024–2036 (Usd Million)
Table 442. Eastern Europe: Food Waste Recycling Market Size, By Feedstock Source, 2024–2036 (Usd Million)
Table 443. Eastern Europe: Food Processing Industry Waste Recycling Market Size, By Type, 2024–2036 (Usd Million)
Table 444. Eastern Europe: Food Service & Hospitality Waste Recycling Market Size, By Type, 2024–2036 (Usd Million)
Table 445. Eastern Europe: Europe Food Waste Recycling Market, By Recycling Method, 2024–2036 (Usd Million)
Table 446. Eastern Europe: Food Waste Recycling By Biological Methods Market Size, By Type, 2024–2036 (Usd Million)
Table 447. Eastern Europe: Food Waste Recycling By Anaerobic Digestion Market Size, By Type, 2024–2036 (Usd Million)
Table 448. Eastern Europe: Food Waste Recycling By Composting Market Size, By Type, 2024–2036 (Usd Million)
Table 449. Eastern Europe: Food Waste Recycling By Fermentation Market Size, By Type, 2024–2036 (Usd Million)
Table 450. Eastern Europe: Food Waste Recycling By Thermochemical Methods Market Size, By Type, 2024–2036 (Usd Million)
Table 451. Eastern Europe: Food Waste Recycling Market, By End Use Application, 2024–2036 (Usd Million)
Table 452. Poland: Food Waste Recycling Market, By Byproduct, 2024–2036 (Usd Million)
Table 453. Poland: Organic Fertilizers Market Size, By Type, 2024–2036 (Usd Million)
Table 454. Poland: Biofuels Market Size, By Type, 2024–2036 (Usd Million)
Table 455. Poland: Animal Feed Market Size, By Type, 2024–2036 (Usd Million)
Table 456. Poland: Biochemicals & High-Value Products Market Size, By Type, 2024–2036 (Usd Million)
Table 457. Poland: Bioplastics Market Size, By Type, 2024–2036 (Usd Million)
Table 458. Poland: Food Waste Recycling Market Size, By Feedstock Source, 2024–2036 (Usd Million)
Table 459. Poland: Food Processing Industry Waste Recycling Market Size, By Type, 2024–2036 (Usd Million)
Table 460. Poland: Food Service & Hospitality Waste Recycling Market Size, By Type, 2024–2036 (Usd Million)
Table 461. Poland: Europe Food Waste Recycling Market, By Recycling Method, 2024–2036 (Usd Million)
Table 462. Poland: Food Waste Recycling By Biological Methods Market Size, By Type, 2024–2036 (Usd Million)
Table 463. Poland: Food Waste Recycling By Anaerobic Digestion Market Size, By Type, 2024–2036 (Usd Million)
Table 464. Poland: Food Waste Recycling By Composting Market Size, By Type, 2024–2036 (Usd Million)
Table 465. Poland: Food Waste Recycling By Fermentation Market Size, By Type, 2024–2036 (Usd Million)
Table 466. Poland: Food Waste Recycling By Thermochemical Methods Market Size, By Type, 2024–2036 (Usd Million)
Table 467. Poland: Food Waste Recycling Market, By End Use Application, 2024–2036 (Usd Million)
Table 468. Czech Republic: Food Waste Recycling Market, By Byproduct, 2024–2036 (Usd Million)
Table 469. Czech Republic: Organic Fertilizers Market Size, By Type, 2024–2036 (Usd Million)
Table 470. Czech Republic: Biofuels Market Size, By Type, 2024–2036 (Usd Million)
Table 471. Czech Republic: Animal Feed Market Size, By Type, 2024–2036 (Usd Million)
Table 472. Czech Republic: Biochemicals & High-Value Products Market Size, By Type, 2024–2036 (Usd Million)
Table 473. Czech Republic: Bioplastics Market Size, By Type, 2024–2036 (Usd Million)
Table 474. Czech Republic: Food Waste Recycling Market Size, By Feedstock Source, 2024–2036 (Usd Million)
Table 475. Czech Republic: Food Processing Industry Waste Recycling Market Size, By Type, 2024–2036 (Usd Million)
Table 476. Czech Republic: Food Service & Hospitality Waste Recycling Market Size, By Type, 2024–2036 (Usd Million)
Table 477. Czech Republic: Europe Food Waste Recycling Market, By Recycling Method, 2024–2036 (Usd Million)
Table 478. Czech Republic: Food Waste Recycling By Biological Methods Market Size, By Type, 2024–2036 (Usd Million)
Table 479. Czech Republic: Food Waste Recycling By Anaerobic Digestion Market Size, By Type, 2024–2036 (Usd Million)
Table 480. Czech Republic: Food Waste Recycling By Composting Market Size, By Type, 2024–2036 (Usd Million)
Table 481. Czech Republic: Food Waste Recycling By Fermentation Market Size, By Type, 2024–2036 (Usd Million)
Table 482. Czech Republic: Food Waste Recycling By Thermochemical Methods Market Size, By Type, 2024–2036 (Usd Million)
Table 483. Czech Republic: Food Waste Recycling Market, By End Use Application, 2024–2036 (Usd Million)
Table 484. Hungary: Food Waste Recycling Market, By Byproduct, 2024–2036 (Usd Million)
Table 485. Hungary: Organic Fertilizers Market Size, By Type, 2024–2036 (Usd Million)
Table 486. Hungary: Biofuels Market Size, By Type, 2024–2036 (Usd Million)
Table 487. Hungary: Animal Feed Market Size, By Type, 2024–2036 (Usd Million)
Table 488. Hungary: Biochemicals & High-Value Products Market Size, By Type, 2024–2036 (Usd Million)
Table 489. Hungary: Bioplastics Market Size, By Type, 2024–2036 (Usd Million)
Table 490. Hungary: Food Waste Recycling Market Size, By Feedstock Source, 2024–2036 (Usd Million)
Table 491. Hungary: Food Processing Industry Waste Recycling Market Size, By Type, 2024–2036 (Usd Million)
Table 492. Hungary: Food Service & Hospitality Waste Recycling Market Size, By Type, 2024–2036 (Usd Million)
Table 493. Hungary: Europe Food Waste Recycling Market, By Recycling Method, 2024–2036 (Usd Million)
Table 494. Hungary: Food Waste Recycling By Biological Methods Market Size, By Type, 2024–2036 (Usd Million)
Table 495. Hungary: Food Waste Recycling By Anaerobic Digestion Market Size, By Type, 2024–2036 (Usd Million)
Table 496. Hungary: Food Waste Recycling By Composting Market Size, By Type, 2024–2036 (Usd Million)
Table 497. Hungary: Food Waste Recycling By Fermentation Market Size, By Type, 2024–2036 (Usd Million)
Table 498. Hungary: Food Waste Recycling By Thermochemical Methods Market Size, By Type, 2024–2036 (Usd Million)
Table 499. Hungary: Food Waste Recycling Market, By End Use Application, 2024–2036 (Usd Million)
Table 500. Romania: Food Waste Recycling Market, By Byproduct, 2024–2036 (Usd Million)
Table 501. Romania: Organic Fertilizers Market Size, By Type, 2024–2036 (Usd Million)
Table 502. Romania: Biofuels Market Size, By Type, 2024–2036 (Usd Million)
Table 503. Romania: Animal Feed Market Size, By Type, 2024–2036 (Usd Million)
Table 504. Romania: Biochemicals & High-Value Products Market Size, By Type, 2024–2036 (Usd Million)
Table 505. Romania: Bioplastics Market Size, By Type, 2024–2036 (Usd Million)
Table 506. Romania: Food Waste Recycling Market Size, By Feedstock Source, 2024–2036 (Usd Million)
Table 507. Romania: Food Processing Industry Waste Recycling Market Size, By Type, 2024–2036 (Usd Million)
Table 508. Romania: Food Service & Hospitality Waste Recycling Market Size, By Type, 2024–2036 (Usd Million)
Table 509. Romania: Europe Food Waste Recycling Market, By Recycling Method, 2024–2036 (Usd Million)
Table 510. Romania: Food Waste Recycling By Biological Methods Market Size, By Type, 2024–2036 (Usd Million)
Table 511. Romania: Food Waste Recycling By Anaerobic Digestion Market Size, By Type, 2024–2036 (Usd Million)
Table 512. Romania: Food Waste Recycling By Composting Market Size, By Type, 2024–2036 (Usd Million)
Table 513. Romania: Food Waste Recycling By Fermentation Market Size, By Type, 2024–2036 (Usd Million)
Table 514. Romania: Food Waste Recycling By Thermochemical Methods Market Size, By Type, 2024–2036 (Usd Million)
Table 515. Romania: Food Waste Recycling Market, By End Use Application, 2024–2036 (Usd Million)
Table 516. Rest Of Eastern Europe: Food Waste Recycling Market, By Byproduct, 2024–2036 (Usd Million)
Table 517. Rest Of Eastern Europe: Organic Fertilizers Market Size, By Type, 2024–2036 (Usd Million)
Table 518. Rest Of Eastern Europe: Biofuels Market Size, By Type, 2024–2036 (Usd Million)
Table 519. Rest Of Eastern Europe: Animal Feed Market Size, By Type, 2024–2036 (Usd Million)
Table 520. Rest Of Eastern Europe: Biochemicals & High-Value Products Market Size, By Type, 2024–2036 (Usd Million)
Table 521. Rest Of Eastern Europe: Bioplastics Market Size, By Type, 2024–2036 (Usd Million)
Table 522. Rest Of Eastern Europe: Food Waste Recycling Market Size, By Feedstock Source, 2024–2036 (Usd Million)
Table 523. Rest Of Eastern Europe: Food Processing Industry Waste Recycling Market Size, By Type, 2024–2036 (Usd Million)
Table 524. Rest Of Eastern Europe: Food Service & Hospitality Waste Recycling Market Size, By Type, 2024–2036 (Usd Million)
Table 525. Rest Of Eastern Europe: Europe Food Waste Recycling Market, By Recycling Method, 2024–2036 (Usd Million)
Table 526. Rest Of Eastern Europe: Food Waste Recycling By Biological Methods Market Size, By Type, 2024–2036 (Usd Million)
Table 527. Rest Of Eastern Europe: Food Waste Recycling By Anaerobic Digestion Market Size, By Type, 2024–2036 (Usd Million)
Table 528. Rest Of Eastern Europe: Food Waste Recycling By Composting Market Size, By Type, 2024–2036 (Usd Million)
Table 529. Rest Of Eastern Europe: Food Waste Recycling By Fermentation Market Size, By Type, 2024–2036 (Usd Million)
Table 530. Rest Of Eastern Europe: Food Waste Recycling By Thermochemical Methods Market Size, By Type, 2024–2036 (Usd Million)
Table 531. Rest Of Eastern Europe: Food Waste Recycling Market, By End Use Application, 2024–2036 (Usd Million)
LIST OF FIGURES
Figure 1. Research Process
Figure 2. Key Secondary Sources
Figure 3. Primary Research Techniques
Figure 4. Key Executives Interviewed
Figure 5. Breakdown of Primary Interviews (Supply-Side & Demand-Side)
Figure 6. Market Sizing and Growth Forecast Approach
Figure 7. Europe Food Waste Recycling Market, By Byproduct, 2026 Vs. 2036 (Usd Million)
Figure 8. Europe Food Waste Recycling Market, By Feedstock Source, 2026 Vs. 2036 (Usd Million)
Figure 9. Europe Food Waste Recycling Market, By Recycling Method, 2026 Vs. 2036 (Usd Million)
Figure 10. Europe Food Waste Recycling Market, By End Use Application, 2026 Vs. 2036 (Usd Million)
Figure 11. Europe Food Waste Recycling Market, By Geography, 2026 Vs. 2036 (Usd Million)
Figure 12. Europe Food Waste Recycling Market, By Product Type, 2026 Vs. 2036 (Usd Million)
Figure 13. Europe Food Waste Recycling Market, By Feedstock Source, 2026 Vs. 2036 (Usd Million)
Figure 14. Europe Food Waste Recycling Market, By Recycling Method, 2026 Vs. 2036 (Usd Million)
Figure 15. Europe Food Waste Recycling Market, By End-Use Application, 2026 Vs. 2036 (Usd Million)
Figure 16. Europe Food Waste Recycling Market, By Region, 2026 Vs. 2036 (Usd Million)
Figure 17. Europe Food Waste Recycling: Competitive Benchmarking, By Region
Figure 18. Competitive Dashboard: Europe Food Waste Recycling Market
Figure 19. Europe Food Waste Recycling Market Position Analysis, 2025
Figure 20. Veolia Environment S.A.: Financial Overview (2025)
Figure 21. Anaergia Inc.: Financial Overview (2025)
Figure 22. Envitec Biogas Ag: Financial Overview (2024)
Figure 23. Hzi International: Financial Overview (2024)


Published Date: Apr-2026
Subscribe to get the latest industry updates