Resources
About Us
Drive-In Theatres Transform into Technology-Enhanced Entertainment Destinations
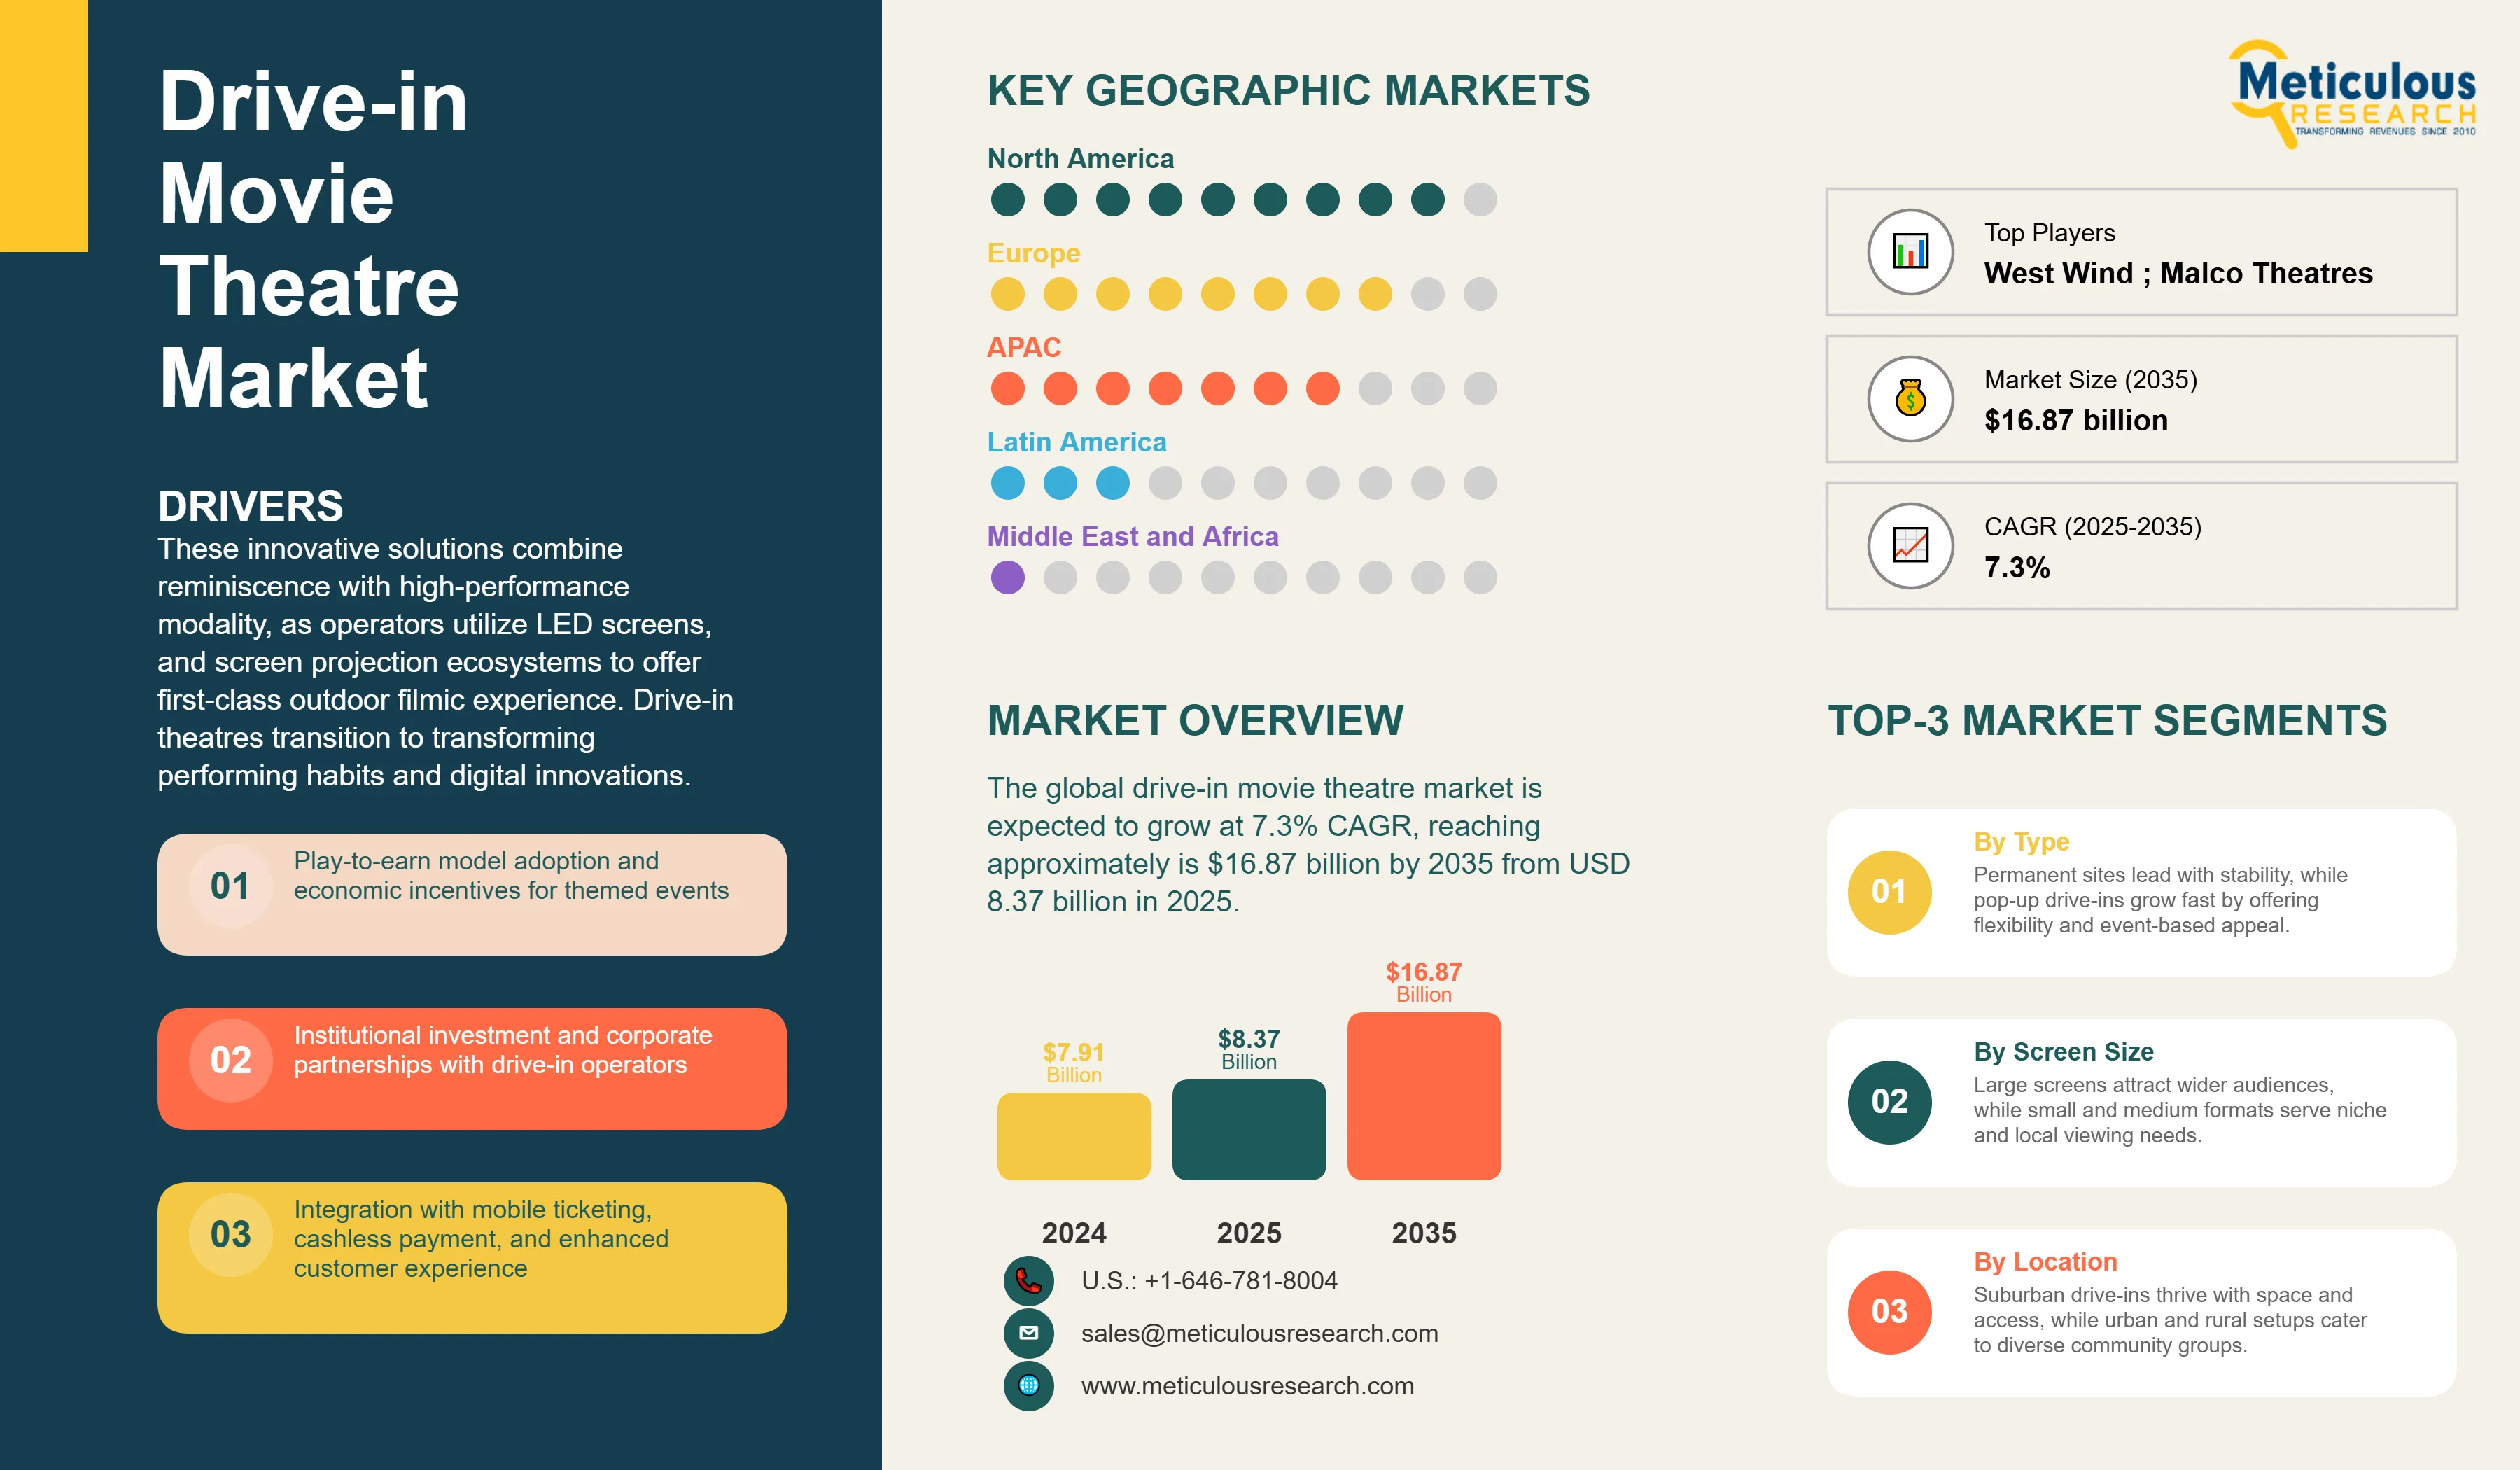
The global drive-in movie theatre market was valued at USD 7.91 billion in 2024. This market is expected to grow at 7.3% CAGR, reaching approximately is $16.87 billion by 2035 from USD 8.37 billion in 2025.
These innovative solutions combine reminiscence with high-performance modality, as operators utilize LED screens, and screen projection ecosystems to offer first-class outdoor filmic experience. Drive-in theatres transition to transforming performing habits and digital innovations. The global business is witnessing a careful retrieval, surged by nostalgia, and outdoor entertainment experience. In 2024, more than 300 drive-in facilities are functioning in the U.S., a 12% surge as compared to 2021 numbers, as per the United Drive-In Theatre Owners Association (UDITOA). Drive-in facilities are now incorporating innovative digital projections, contactless registrations, and food delivery services to sustain the market competition. The market potential features a mixed outlook, with growth avenues in suburban and rural zones, specifically in North America and certain geographies in Asia-Pacific.
Click here to: Get Free Sample Pages of this Report
The competitive scenario comprises legacy players such as Drive-In Theatres Inc., regional competitors, and new entrants incorporating innovative, hybrid systems. For instance, in 2024, Cinewave introduced a mobile drive-in system, allowing pop-up screenings in urban centers. Similarly, AMC collaborated with Walmart to feature drive-in proceedings in around 150 locations, integrating retail and entertainment. These companies are utilizing brand collaborations, influencer advertising, and theme-based programming to distinguish from the competition.
Recent Developments
Sony Pictures Entertainment Acquires Alamo Drafthouse Cinema
Key Market Drivers
Key Market Restraints
Base CAGR: 7.3%
|
Category |
Key Factor |
Short-Term Impact (2025–2028) |
Long-Term Impact (2029–2035) |
Estimated CAGR Impact |
|
Drivers |
1. Growing Cultural Nostalgia |
Increased vintage event attendance |
Sustained retro entertainment growth |
▲ +4.5% |
|
2. Rising Demand for Outdoor Entertainment |
Higher seasonal occupancy |
Year-round diversified outdoor events |
▲ +5.0% |
|
|
3. Technological Advancements in Digital Projection and Sound Systems |
Enhanced viewing and audio quality |
Constant tech upgrades for premium UX |
▲ +5.3% |
|
|
Restraints |
1. Challenge Posed by Streaming Platforms |
Declining weekday attendance |
Continued competition for leisure time |
▼ −3.0% |
|
2. Weather Dependency and Seasonal Limitations |
Weather-related cancellations |
Investments in weather-resilient setups |
▼ −2.5% |
|
|
Opportunities |
1. Expansion into emerging urban and suburban markets worldwide |
New venue openings and audience growth |
Saturation leading to market consolidation |
▲ +5.5% |
|
2. Partnerships with restaurants, food trucks, and delivery for on-site service |
Enhanced consumer experience |
Integrated entertainment and dining hubs |
▲ +4.8% |
|
|
Trends |
1. Use of QR codes and digital access for ticketing and concessions |
Faster transactions and contactless payment |
Industry standard for customer convenience |
▲ +3.7% |
|
Challenges |
1. Scalability issues for independent and pop-up drive-in models |
Limited event capacity and reach |
Development of franchise and cooperative models |
▼ −2.0% |
Regional Analysis
Drive-ins benefit from nostalgia and suburban expansion in North America
North America is estimated to command the largest share of 40% of the global drive-in movie theatre market. The region dominates with more than 300 active venues in the United States alone. Demand is bolstered by suburban migration and car-centric lifestyles, particularly in states such as Ohio, Pennsylvania, and Texas. According to a 2024 Pew Research study, 29% of Americans attend at least one outdoor entertainment event each year. Grants and zoning flexibility are being provided by local governments to safeguard historic venues. Ontario and British Columbia have experienced a 19% increase in drive-in attendance, and Canada is also experiencing growth.
Urban constraints offset rising demand in rural areas in the Asia Pacific region
Asia-Pacific is the fastest-growing market, with a projected CAGR of 9.0% through 2035. The region is currently experiencing a fragmented drive-in market, with rural India, Australia, and certain regions of Southeast Asia experiencing substantial growth. In 2024, drive-in theaters in Tier 2 cities in India expanded by 22%, assisted by increasing mobile penetration and car ownership. Nevertheless, the scalability of major cities is constrained by urban density and land scarcity. Queensland has reported a 17% increase in attendance, as drive-ins are being revived as part of tourism campaigns in Australia.
Country-level Analysis
Policy support and community engagement in the U.S. sustain market growth
The U.S. drive-in market is estimated to hold 85% market share in North America region in 2025. The country continues to be the global leader in the operation of drive-in theaters. In 2024, more than USD 10 million in federal and state grants were allocated to the preservation of cultural venues, such as drive-ins. Foot traffic is stimulated by local events and school partnerships, which are indicative of robust community engagement. According to a 2024 Gallup poll, 34% of Americans prefer outdoor entertainment to indoor venues. Operators are also conducting experiments with hybrid models, which encompass live performances and food truck festivals.
Drive-in theatres emerge as premium leisure experiences in China
China is growing at a substantial pace, with projections show the country market is set to grow at 10% growth rate. Drive-in restaurants are a niche market in China, but they are expanding, particularly in the affluent urban outskirts. Luxury car owners and lifestyle influencers were the primary drivers of a 15% increase in drive-in attendance in Shanghai and Shenzhen in 2024. The development of multi-use entertainment parks has been facilitated by government support for outdoor cultural events. Nevertheless, urban density and land use regulations continue to serve as impediments to expansion.
Sustainability and heritage preservation drives the German market interest
Germany represents the largest European drive-in market. Drive-in theaters in Germany are reaping the rewards of green mobility trends and cultural preservation initiatives. A 12% increase in drive-in attendance was reported in Berlin and Munich in 2024, which was facilitated by eco-friendly infrastructure and electric vehicle incentives. The "Kultur im Freien" initiative of the government encourages the use of outdoor cultural venues, such as drive-ins. In order to comply with sustainability objectives, operators are incorporating solar panels and EV charging stations.
Mid-Range Screens Balance Cost Efficiency with Viewing Quality
Based on screen size, the 20-50 ft screen segment is estimated to hold the largest share of 50% of the global drive-in movie theatre market in 2025. These mid-range screens provide good visibility for a range of car sizes and parking arrangements, catering to a variety of venue types from individual operators to regional chains. While providing better viewing experiences than tiny sub-20-foot displays, installation and maintenance expenses are still reasonable when compared to bigger screens that are more than 50 feet in length. Within this size range, technology integration such as digital projection systems and LED panels scales efficiently, allowing venues to improve visual quality without incurring prohibitive capital costs. The sector is the go-to option for both new market entrants and experienced operators looking to expand because of its adaptability in catering to both small-scale community events and big commercial activities.
Restaurant Parking Lots Drive Revenue Through Integrated Experiences
Based on application, the restaurant parking lots segment is estimated to witness rapid growth during the forecast period. The growth of this segment is majorly driven by leveraging existing infrastructure and established customer bases. These venues transition lowly utilized parking lots into revenue-generating entertainment assets during non-peak hours, offering restaurants with supplementary cash streams while providing consumers with incorporated dining-entertainment experiences. Partnerships among drive-in operators and restaurant proprietors gradually engage in revenue-sharing agreements that profit both parties through surge in foot traffic and improved customer engagement. Food service integration eliminates traditional concession stand requirements while providing superior dining options that differentiate venues from standard drive-in facilities. Urban restaurant partnerships particularly excel by offering convenient access for metropolitan audiences who might otherwise lack access to suburban drive-in locations.
|
Report Attribute |
Details |
|
Market size (2025) |
USD 8.37 billion |
|
Revenue forecast in 2035 |
USD 16.87 billion |
|
CAGR (2025-2035) |
7.3% |
|
Base Year |
2024 |
|
Forecast period |
2025 – 2035 |
|
Report coverage |
Market size and forecast, competitive landscape and benchmarking, country/regional level analysis, key trends, growth drivers and restraints |
|
Segments covered |
Screen Size, Area Type (Small Scale, Large Scale), Technology (2D, 3D, 4K/LED), By Application (Restaurant Parking Lots, Theater Parking Lots), Geography |
|
Regional scope |
North America, Europe, Asia-Pacific, Latin America, and Middle East & Africa |
|
Key companies profiled |
West Wind Drive-Ins; Malco Theatres, Inc.; Holiday Twin Drive-In; Starlite Drive-In Theatre; Four Brothers Drive-In Theatre; Drive-In Film Festival, Inc.; Sunset Drive-In Theatre; USA Drive-Ins; Field of Dreams Drive-In; Bengies Drive-In Theatre; Digital Drive-In AZ; The Drive-In Theatre Association; Rooftop Cinema Club; |
|
Customization |
Comprehensive report customization with purchase. Addition or modification to country, regional & segment scope available |
|
Pricing Details |
Access customized purchase options to meet your specific research requirements. Explore flexible pricing models |
The Drive-in Movie Theatre Market size is estimated to be USD 8.37 billion in 2025 and grow at a CAGR of 7.3% to reach USD 16.87 billion by 2035.
In 2024, the Drive-in Movie Theatre Market size was estimated at USD 7.91 billion, with projections to reach USD 8.37 billion in 2025.
West Wind Drive-Ins, Malco Theatres, Inc., Holiday Twin Drive-In, Starlite Drive-In Theatre, Four Brothers Drive-In Theatre, Drive-In Film Festival, Inc., Sunset Drive-In Theatre, USA Drive-Ins, Field of Dreams Drive-In, Bengies Drive-In Theatre, Digital Drive-In AZ, The Drive-In Theatre Association, and Rooftop Cinema Club among others are the major companies operating in the Drive-in Movie Theatre Market.
The Asia-Pacific region is projected to grow at the highest CAGR over the forecast period (2025-2035).
Theatre parking lots hold the largest share by application, primarily because they already have the necessary infrastructure, location accessibility, and audience familiarity for movie screenings.
1. Market Definition & Scope
1.1. Market Definition
1.2. Market Ecosystem
1.3. Currency
1.4. Key Stakeholders
2. Research Methodology
2.1. Research Approach
2.2. Process of Data Collection and Validation
2.2.1. Secondary Research
2.2.2. Primary Research/Interviews with Key Opinion Leaders from the Industry
2.3. Market Sizing and Forecast
2.3.1. Market Size Estimation Approach
2.3.1.1. Bottom-up Approach
2.3.1.2. Top-down Approach
2.3.2. Growth Forecast Approach
2.3.3. Assumptions for the Study
3. Executive Summary
3.1. Overview
3.2. Segmental Analysis
3.2.1. Drive-in Movie Theatre Market, by Screen Size
3.2.2. Drive-in Movie Theatre Market, by Area Type
3.2.3. Drive-in Movie Theatre Market, by Technology
3.2.4. Drive-in Movie Theatre Market, by Application
3.2.5. Drive-in Movie Theatre Market, by Region
3.3. Competitive Landscape
3.4. Strategic Recommendations
4. Market Insights
4.1. Overview
4.2. Factors Affecting Market Growth
4.2.1. Drivers
4.2.1.1. Play-to-earn model adoption and economic incentives for themed events
4.2.1.2. Institutional investment and corporate partnerships with drive-in operators
4.2.1.3. Integration with mobile ticketing, cashless payment, and enhanced customer experience
4.2.2. Restraints
4.2.2.1. Regulatory uncertainty and zoning constraints in various regions
4.2.2.2. User scepticism about content quality and projection standards
4.2.2.3. Weather dependence and seasonal limitations
4.2.3. Opportunities
4.2.3.1. Integration of drive-ins with concerts, sports, comedy events, and communal experiences
4.2.3.2. Expansion into emerging urban and suburban markets worldwide
4.2.3.3. Partnerships with restaurants, food trucks, and delivery for on-site service
4.2.4. Trends
4.2.4.1. Rise of “event cinema” (pop culture screenings, live concerts, sporting events)
4.2.4.2. Use of QR codes and digital access for ticketing and concessions
4.2.5. Challenges
4.2.5.1. Infrastructure upkeep and high operational costs for big screens/modernization
4.2.5.2. Scalability issues for independent and pop-up drive-in models
4.3. Porter's Five Forces Analysis
4.3.1. Bargaining Power of Suppliers
4.3.2. Bargaining Power of Buyers
4.3.3. Threat of Substitutes
4.3.4. Threat of New Entrants
4.3.5. Degree of Competition
4.4. Technology Impact on Drive-in Movie Theatre Market
4.4.1. Digital projection and 4K/3D upgrades for improved image & sound quality
4.4.1.1. FM radio and app-linked audio systems
4.4.1.2. LED screens and energy-efficient setups
4.4.2. Cloud-based ticketing, mobile apps, and loyalty platforms
4.4.2.1. Seamless online transactions and contactless entry
4.4.2.2. Real-time seat/spot selection
4.4.3. Food ordering integration and live streaming of alternative content
5. Impact of Sustainability on Drive-in Movie Theatre Market
5.1. Less energy and infrastructure than indoor multiplexes
5.2. Supports local vendors and reusable venues for multiple events
5.3. Lower travel/footprint due to suburban/rural locations
5.4. Drives awareness for environmental and social themes through curated content
5.5. Challenges include waste management and noise control rules
5.6. Seasonal/pop-up models reduce idle resource usage
5.7. Potential for solar-powered or net-zero venues
6. Competitive Landscape
6.1. Overview
6.2. Key Growth Strategies
6.3. Competitive Benchmarking
6.4. Competitive Dashboard
6.4.1. Industry Leaders
6.4.2. Market Differentiators
6.4.3. Vanguards
6.4.4. Contemporary Stalwarts
6.5. Market Share/Ranking Analysis, by Key Players, 2024
7. Drive-in Movie Theatre Market Assessment—By Screen Size
7.1. Overview
7.2. Up to 20 ft
7.3. 20–50 ft
7.4. Above 50 ft
8. Drive-in Movie Theatre Market Assessment—By Area Type
8.1. Overview
8.2. Small Scale
8.3. Large Scale
9. Drive-in Movie Theatre Market Assessment—By Technology
9.1. Overview
9.2. 2D
9.3. 3D
9.4. 4K/LED
10. Drive-in Movie Theatre Market Assessment—By Application
10.1. Overview
10.2. Restaurant Parking Lots
10.3. Theatre Parking Lots
10.4. Parks & Recreational Spaces
10.5. Festivals/Temporary Pop-up Locations
11. Drive-in Movie Theatre Market Assessment—By Geography
11.1. Overview
11.2. North America
11.2.1. U.S.
11.2.2. Canada
11.3. Europe
11.3.1. Germany
11.3.2. U.K.
11.3.3. France
11.3.4. Netherlands
11.3.5. Switzerland
11.3.6. Rest of Europe
11.4. Asia-Pacific
11.4.1. China
11.4.2. Japan
11.4.3. South Korea
11.4.4. Taiwan
11.4.5. India
11.4.6. Singapore
11.4.7. Australia
11.4.8. Rest of Asia-Pacific
11.5. Latin America
11.5.1. Brazil
11.5.2. Mexico
11.5.3. Argentina
11.5.4. Rest of Latin America
11.6. Middle East & Africa
11.6.1. UAE
11.6.2. Saudi Arabia
11.6.3. Israel
11.6.4. South Africa
11.6.5. Rest of Middle East & Africa
12. Company Profiles (Business Overview, Financial Overview, Product Portfolio, Strategic Developments, and SWOT Analysis)
12.1. West Wind Drive-Ins
12.2. Malco Theatres, Inc.
12.3. Holiday Twin Drive-In
12.4. Starlite Drive-In Theatre
12.5. Four Brothers Drive-In Theatre
12.6. Drive-In Film Festival, Inc.
12.7. Sunset Drive-In Theatre
12.8. USA Drive-Ins
12.9. Field of Dreams Drive-In
12.10. Bengies Drive-In Theatre
12.11. Digital Drive-In AZ
12.12. The Drive-In Theatre Association
12.13. Rooftop Cinema Club
12.14. The Wellfleet Drive-In Theatre
12.15. The Family Drive-In Theatre
12.16. The Moonlite Drive-In Theatre
12.17. The Blue Starlite Mini Urban Drive-In
12.18. The Admiral Twin Drive-In Theatre
12.19. Others
13. Appendix
13.1. Available Customization
13.2. Related Reports


Published Date: Sep-2024
Published Date: Aug-2025
Subscribe to get the latest industry updates