Physical AI Market (2026-2036)
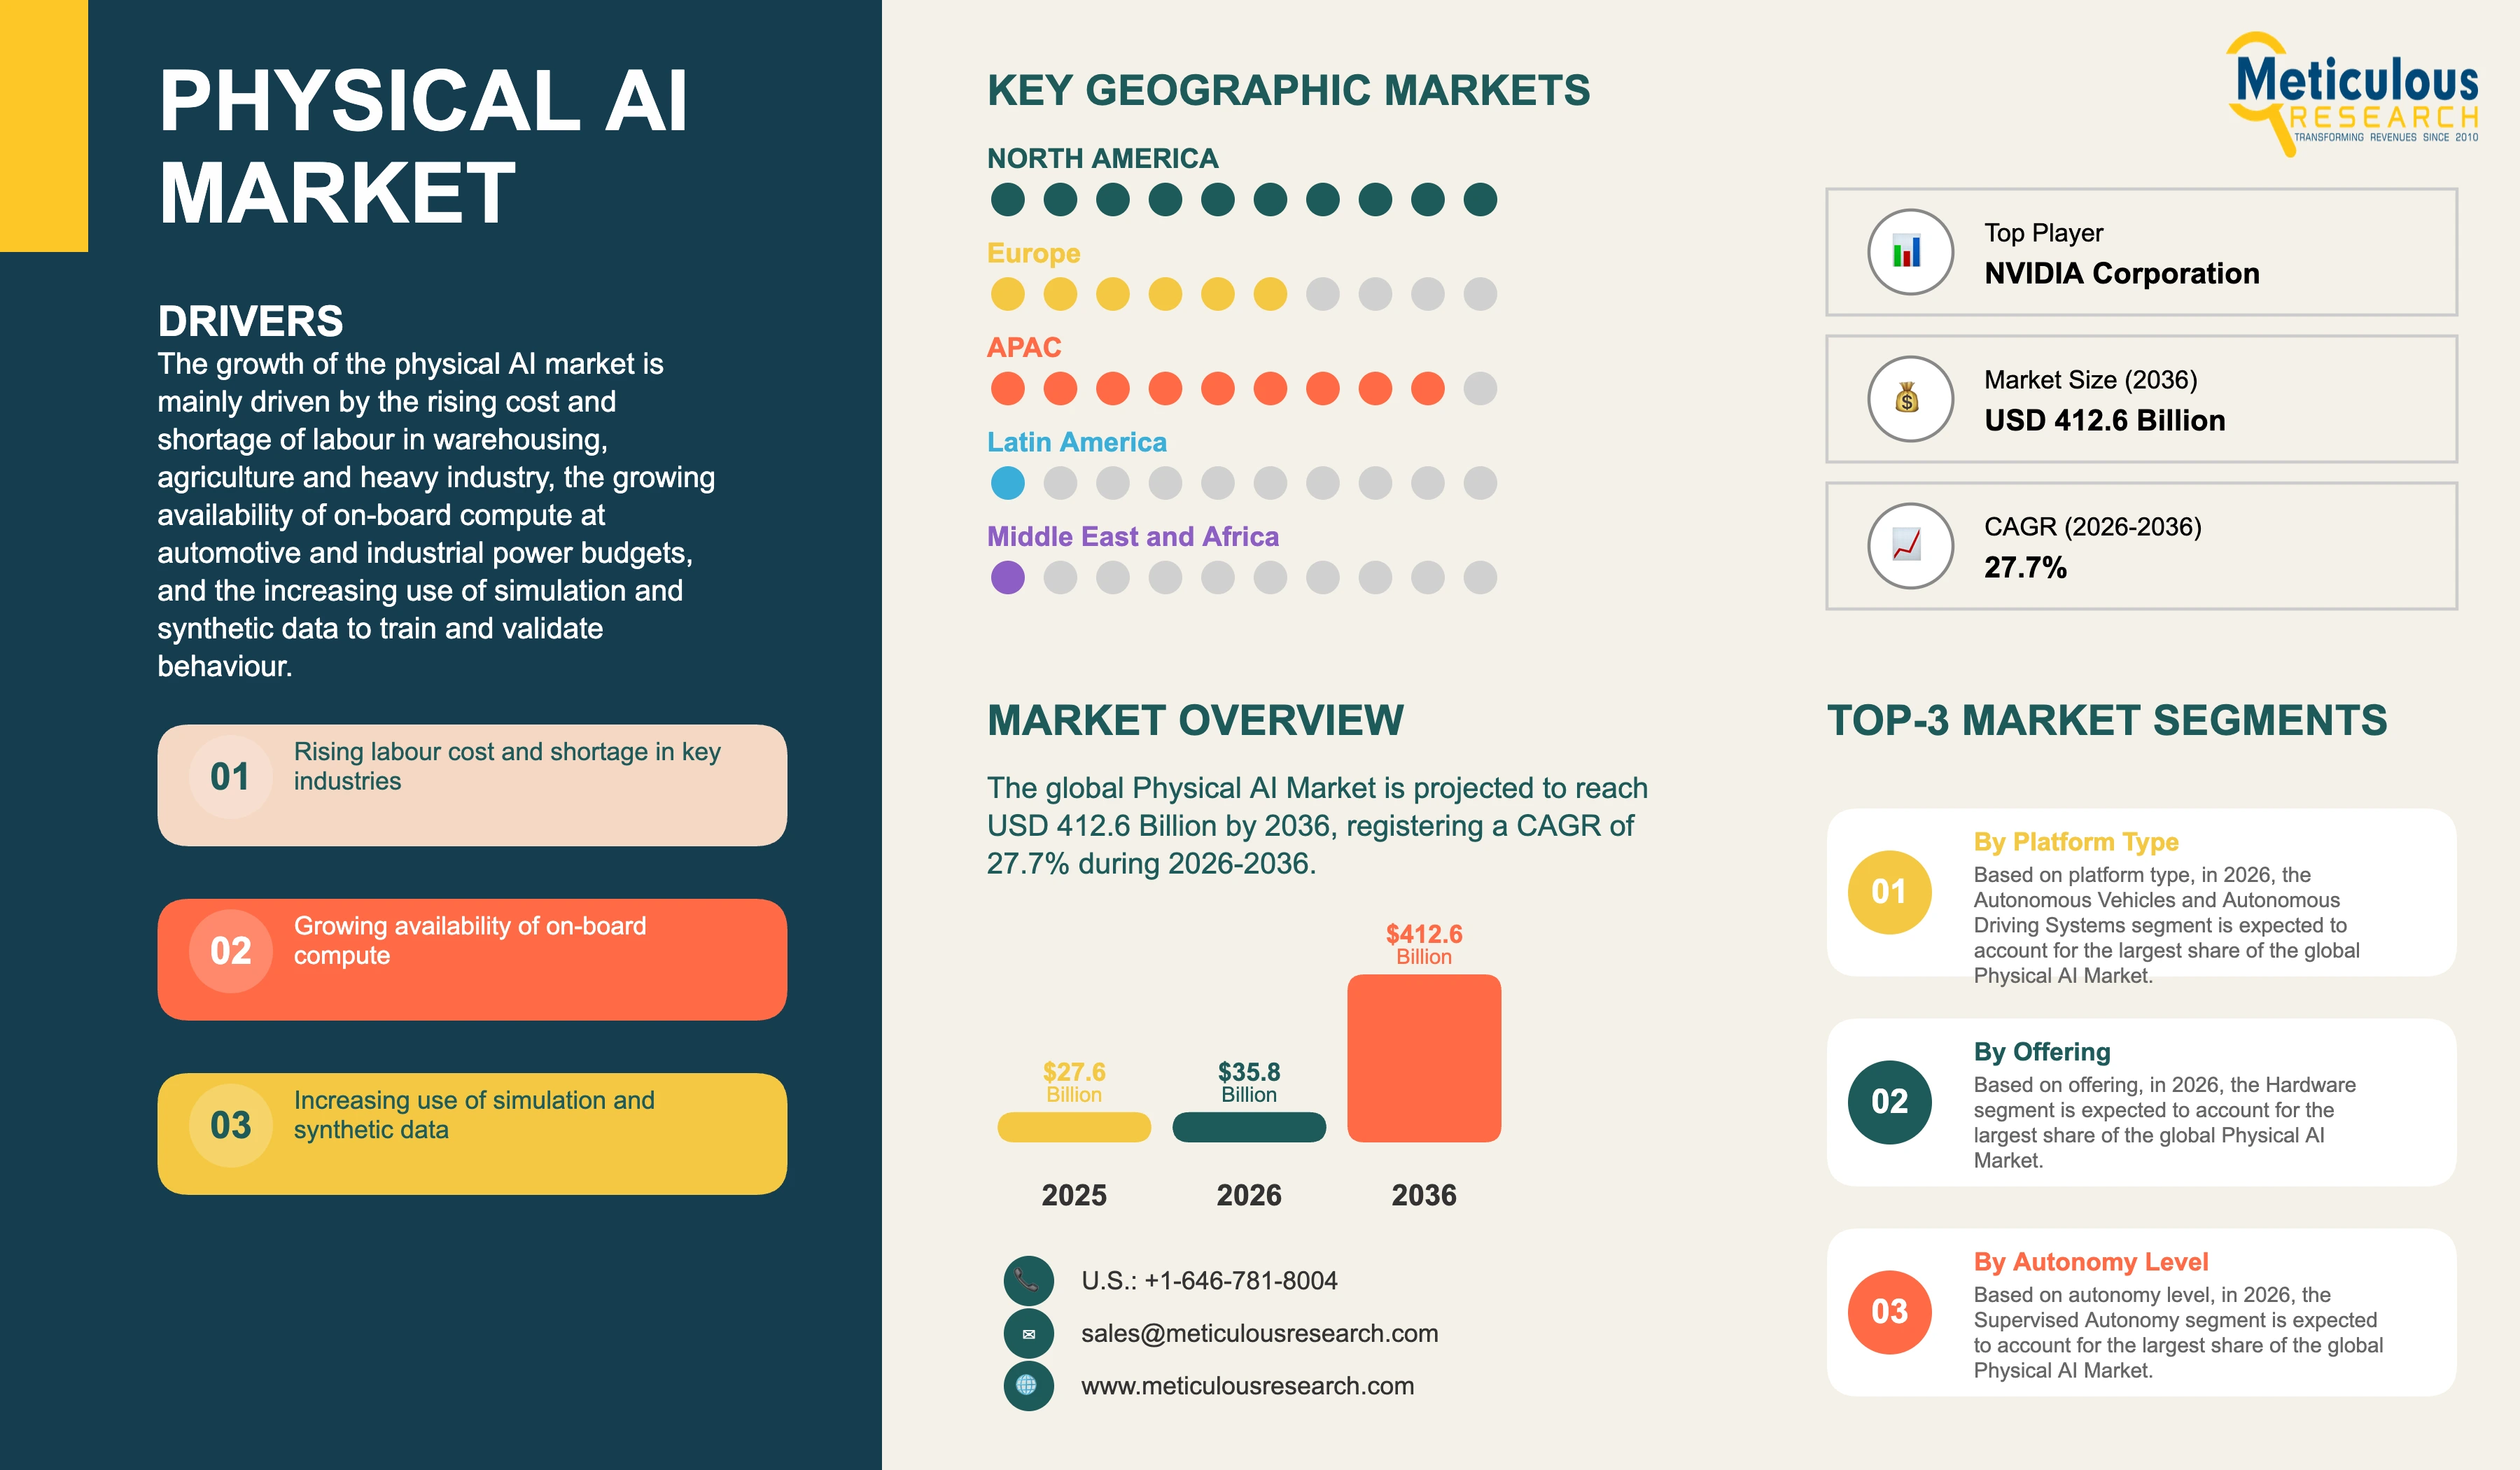
The global physical AI market was valued at USD 27.60 billion in 2025. This market is expected to reach USD 412.60 billion by 2036 from an estimated USD 35.80 billion in 2026, registering a CAGR of 27.7% during the forecast period (2026-2036). The market stood at USD 21.40 billion in 2024, and the expansion since then has come from autonomy systems reaching commercial duty cycles in logistics, mining and ride-hailing rather than from broad availability of general-purpose machines, which concentrates the installed base in a small number of operating environments.
- Published
- Nov 2026
- Pages
- 289
- Format
- PDF + Excel
- Report ID
- MRICT - 1042463
- Base year
- 2025
- 2024 · HISTORICAL
- $21.40B
- 2036
- $412.6B
- CAGR 2026–2036
- 27.7%
2024–2025 baseline · 2026–2036 forecast at 27.7% CAGR · hover a bar for the value
Key highlights
ISO 10218-1:2025 was published in February 2025 as the third version of the industrial robot safety standard and excludes robots fixed to or forming part of mobile platforms.
The same standard also excludes public-access service robots, consumer products and the lifting or transporting of people, which leaves general-purpose mobile humanoids without a single governing standard.
Section 107.35 of Title 14 CFR permits one remote pilot per unmanned aircraft at a time, which caps drone operating economics unless a waiver is granted.
Waivers under section 107.200 can cover the visual line of sight, one-aircraft and operations-over-people rules listed at section 107.205, making the waiver rather than the aircraft the commercial asset.
Humanoid and general-purpose robots are the fastest-growing platform type at a CAGR of 42.6%, from the smallest commercial base among the major platform classes.
Full autonomy with the human out of the loop is the fastest-growing autonomy level at a CAGR of 35.2% and accounts for 18.6% of the market in 2026.
Software grows faster than hardware across the forecast because validation workloads scale with the operating environment rather than with unit shipments.
By platform type, autonomous vehicles and autonomous driving systems account for the largest share of 38.6% in 2026, while humanoid and general-purpose robots register the highest CAGR.
By offering, hardware accounts for the largest share of 54.2%, while software registers the highest CAGR of 30.0%.
By autonomy level, supervised autonomy accounts for the largest share of 48.6%, while full autonomy registers the highest CAGR.
By end-use industry, automotive and mobility accounts for the largest share of 26.4%, while healthcare, retail and other services register the highest CAGR of 30.4%.
By geography, North America accounts for the largest share of 36.8% in 2026, while Asia-Pacific registers the highest CAGR of 30.0%.
Report summary
| Particulars | Details |
|---|---|
| Base Year | 2025 |
| Estimated Year | 2026 |
| Forecast Period | 2026-2036 |
| Market Size in 2025 | USD 27.60 billion (4.70 million units) |
| Market Size in 2026 | USD 35.80 billion (6.14 million units) |
| Market Size by 2036 | USD 412.60 billion (78.60 million units) |
| CAGR (2026-2036) | 27.7% by value and 29.0% by volume |
| Format | PDF, Excel & Cloud Portal · 289 pages |
| Blended Average Selling Price | USD 5,830 per unit in 2026 to USD 5,250 per unit by 2036 |
| Largest Segment by Platform Type (2026) | Autonomous vehicles and autonomous driving systems (38.6%) |
| Fastest-Growing Segment by Platform Type | Humanoid and general-purpose robots (CAGR 42.6%) |
| Largest Region (2026) | North America (36.8%) |
| Fastest-Growing Region | Asia-Pacific (CAGR 30.0%) |
| Companies Profiled | 17 companies and other companies |
| Segments Covered | Platform Type, Offering, Autonomy Level, End-Use Industry, Geography |
| Countries Covered | U.S., Canada, Germany, U.K., France, Italy, Spain, Netherlands, Sweden, Rest of Europe, China, Japan, South Korea, India, Taiwan, Australia, Singapore, Rest of Asia-Pacific, Brazil, Mexico, Chile, Rest of Latin America, Saudi Arabia, U.A.E., Israel, South Africa, Rest of Middle East & Africa |
Report overview
Segments covered: platform type, offering, autonomy level, end-use industry.
The growth of this market is mainly driven by the rising cost and shortage of labour in warehousing, agriculture and heavy industry, the growing availability of on-board compute able to run perception and control models at automotive and industrial power budgets, the increasing use of simulation and synthetic data to train and validate behaviour before field deployment, and the expanding deployment of autonomy in enclosed and permissioned environments where no public road or airspace approval is required. However, factors such as the absence of a harmonised safety standard covering general-purpose mobile robots in workplaces, the requirement for one remote pilot per unmanned aircraft absent a waiver, the unresolved allocation of liability when an autonomous system causes harm, and the cost of validating behaviour across the long tail of conditions a machine will meet in service are expected to restrain the growth of this market to some extent.
In volume terms, shipments of autonomous systems are expected to reach 78.60 million units by 2036 from an estimated 6.14 million units in 2026 and 4.70 million units in 2025, registering a CAGR of 29.0% during the forecast period, with the blended average selling price declining from USD 5,830 per unit to USD 5,250 per unit as drones and mobile robots add unit volume faster than humanoid and vehicle autonomy systems add value per unit.
The blended price covers platform classes whose individual prices differ by three orders of magnitude, so the modest decline reflects the shifting mix between them rather than price erosion in any single class, where prices hold or rise as sensing and compute content increases.
Physical AI covers systems that perceive, decide and act in the physical world, and the market is measured as the value of the autonomy stack together with the platforms whose primary function is autonomous operation, with vehicle autonomy counted at the value of the driving system rather than of the vehicle carrying it. Platform type describes the class of machine and end-use industry describes the buyer that deploys it, and suppliers hold the two apart in the same way, selling a platform family into several industries and serving one industry with several platform families. Capability has advanced faster than the permission to use it, and in every platform class revenue follows whether an operator may run the machine in the environment where the work is rather than whether the machine can perform the task, which is why announcements and deployed fleets diverge so widely here.
ISO 10218-1:2025, Robotics, Safety requirements, Part 1: Industrial robots, published in February 2025 as the third version of the standard specifies safety requirements for industrial robots treated as partly completed machinery, covering inherently safe design, risk reduction measures and the information users need, and addressing the robot before it is integrated into a system, which is covered by ISO 10218-2. The same standard excludes robots used underwater, in law enforcement, military, airborne and space applications, in medical and healthcare use, in prosthetics, as public-access service robots, as consumer products and for lifting or transporting people, and excludes the robot or manipulator when it is fixed to or forms part of driverless industrial trucks or mobile platforms. A general-purpose humanoid working alongside people in a warehouse therefore falls outside the standard that governs industrial robot safety, because it is a mobile platform, and outside the consumer and service robot categories that the standard also excludes. Deployments proceed under site-specific risk assessment agreed between supplier and operator, which is why humanoid order books are expressed in pilot agreements and segregated cells rather than in fleet contracts, and why the segment grows from a small commercial base despite the volume of announcements.
Unmanned aircraft face a permission constraint that is explicit rather than absent. Part 107 of Title 14 of the Code of Federal Regulations requires that the remote pilot in command, the person manipulating the flight controls and any visual observer be able to see the aircraft throughout the entire flight, and provides at section 107.35 that a person may not manipulate flight controls or act as remote pilot in command for more than one unmanned aircraft at the same time. Part 107 further limits groundspeed to 87 knots and altitude to 400 feet above ground level except within a 400-foot radius of a structure, prohibits operation over a human being at section 107.39 unless the person is participating in the operation, is under a covered structure or inside a stationary vehicle offering reasonable protection, or the operation meets one of the Categories 1 to 4 in subpart D, and allows the Administrator to issue a certificate of waiver at section 107.200 for the regulations listed at section 107.205, which include sections 107.31, 107.35, 107.39, 107.51 and 107.145. One pilot per aircraft places a labour cost under every flight hour, which removes the economic advantage of an unmanned platform in any application where a human could do the same work from the ground. The waiver rather than the airframe is therefore the commercial asset, and the detect-and-avoid capability that supports a waiver application is where the autonomy value sits.
Enclosed and permissioned environments account for the large majority of deployed autonomy because they remove the approval question altogether. Warehouses, ports, mines, farms and private industrial sites are controlled by a single operator who can restrict access, define the operating envelope and accept the residual risk, and the duty cycles there are repetitive enough that validation is tractable. Public roads and shared airspace carry the larger long-term opportunity and the slower conversion, which is the reason logistics and mining autonomy reached commercial operation years before ride-hailing in open traffic.
Automotive and industrial grade accelerators now run perception and control models within the power, thermal and functional safety budgets of a vehicle or a mobile robot, which moves the difficulty from inference capacity to the data and validation needed to trust the output. Spending has followed that shift, with simulation, synthetic data generation and scenario-based validation growing faster than the sensing hardware they test, and on-board compute has stopped being the factor that limits what a platform can attempt.
Training approaches have converged on learning from demonstration and from simulated interaction rather than on hand-written behaviour, and the economic consequence is that capability accrues to whoever holds the operational data. A fleet running in service generates the edge cases that improve the model, so early deployment compounds into a capability lead that a later entrant cannot buy, and this is the mechanism behind the concentration of autonomy capability among operators with vehicles or robots already working.
Supply divides between compute and software platform suppliers, established robotics and vehicle manufacturers, and venture-funded specialists building new platform classes. The platform suppliers sell into all three of the others and carry the least deployment risk, the manufacturers hold the industrial channel and the safety engineering experience, and the specialists hold the newest platform designs with the least validated field record. Most commercial humanoid and autonomous vehicle programmes now pair a specialist with a manufacturer, because neither the platform nor the channel alone is sufficient to deliver a qualified machine.
North America, with a 36.8% share in 2026 valued at USD 13,174.4 million, at a CAGR of 27.0%.
Asia-Pacific, at a CAGR of 30.0%, valued at USD 12,386.8 million in 2026.
Europe accounts for 22.4% of the market in 2026, valued at USD 8,019.2 million, at a CAGR of 25.4%, led by Germany, France, the Nordic countries, the Netherlands and Italy.
The Middle East & Africa accounts for 3.6% in 2026, valued at USD 1,288.8 million, at a CAGR of 28.2%, and Latin America for 2.6%, valued at USD 930.8 million, at a CAGR of 26.0%.
The report profiles 17 companies, including NVIDIA Corporation, Tesla, Inc., Alphabet Inc., Amazon.com, Inc., Intel Corporation and ABB Ltd. The top five players account for an estimated 34.8% of the market in 2026.
Humanoid and general-purpose robots, at a CAGR of 42.6%, valued at USD 3,436.8 million in 2026.
Supervised autonomy, with a 48.6% share in 2026 valued at USD 17,398.8 million.
Full autonomy, at a CAGR of 35.2%, valued at USD 6,658.8 million in 2026.
Automotive and mobility, with a 26.4% share in 2026 valued at USD 9,451.2 million, at a CAGR of 26.0%.
Report infographic
Market dynamics
15 factors across 5 forcesRising cost and shortage of labour in warehousing, agriculture and heavy industry
Work that is physically demanding, repetitive and performed in uncomfortable conditions carries persistent vacancy rates and high turnover, and in warehousing, agriculture and heavy industry the employer bears recruitment and retraining cost continuously rather than once. Autonomy is evaluated against that running cost rather than against a wage, which is why the business case holds at machine prices that look high against a single year of labour. Operators also value the predictability of a machine shift over the variability of a staffed one, particularly in seasonal work where the labour simply may not be available at any price.
The applications adopted first are those where the task is narrow and the environment is controlled, because the validation effort is proportional to the variety of conditions the machine must handle. Pallet movement, trailer unloading, inventory counting, crop scouting and haul truck operation have all converted on that basis, and each conversion establishes the duty cycle data that supports the next application on the same site.
Growing availability of on-board compute at automotive and industrial power budgets
Perception and control models that required rack-scale compute now run on single automotive and industrial grade modules within vehicle power, thermal and functional safety budgets, which removes the physical obstacle that confined autonomy to demonstration vehicles. The consequence is that platform cost is now dominated by sensing, actuation and integration rather than by processing, and that the same software stack can be carried across platform classes with different physical designs. Suppliers have responded by selling compute together with a software development stack, which makes the compute choice a long-term architectural commitment for the buyer.
Availability of qualified compute has also shortened development cycles for new platform classes. A humanoid or mobile robot developer can take a validated compute module and a maintained software stack rather than building both, which is why the number of credible platform programmes has risen faster than the number of organisations with deep autonomy engineering capability.
Increasing use of simulation and synthetic data to train and validate behaviour
Field testing cannot generate enough exposure to rare conditions to establish confidence in a safety-relevant behaviour, because the rarest events are the ones that matter and they occur at intervals measured in millions of operating hours. Simulation produces those conditions on demand, and synthetic sensor data supplies training examples for situations that have not yet been encountered, which converts validation from an exposure problem into a coverage problem. Scenario libraries have consequently become an asset in their own right, maintained and extended rather than discarded after a programme.
The same tooling supports the evidence an operator needs when no standard specifies the required testing. Where approval rests on a site-specific risk assessment or a waiver application, a documented scenario set with results is what the operator and the regulator read, so simulation spending is driven by the approval process as much as by engineering need. This is why simulation and synthetic data grow faster than the sensing hardware they model.
Expanding deployment of autonomy in enclosed and permissioned environments
A single operator controlling access to a site can define the operating envelope, exclude untrained people, and accept residual risk under its own safety management system, which removes the approval dependency that paces public road and airspace deployment. Ports, mines, warehouses, farms and industrial plants all qualify, and the repetitive duty cycles found there also make validation tractable. The result is that deployed autonomy is concentrated in environments representing a small fraction of total addressable work but close to the whole of current revenue.
Operators in these environments also measure the benefit directly, because they own both the cost of the work and the consequence of an incident. Haul truck autonomy in mining and tractor autonomy in row crops were adopted on that arithmetic years before comparable technology reached public roads, and the pattern is repeating in trailer unloading and yard logistics.
Table of contents
12 chapters · 157 sections · 289 pages · click to expandSegmental analysis
| Segment | Largest share (2026) | Fastest growth (2026–2036) |
|---|---|---|
| By Platform Type | Autonomous vehicles and autonomous driving systems | Rapid growth of this |
| By Offering | Hardware | Rapid growth of this |
| By Autonomy Level | Supervised autonomy segment, in which a person | Rapid growth of this |
| By End-Use Industry | Automotive and mobility | Rapid growth of this |
By Platform Type
- The autonomous vehicles and autonomous driving systems segment is expected to account for the largest share of 38.6% of the global physical AI market, valued at USD 13,818.8 million.
- The large share of this segment is mainly due to the sensing, compute and software content carried by each vehicle, which is the highest of any platform class on a per-unit basis, and to commercial ride-hailing and long-haul freight programmes that have moved from testing into revenue service in defined operating areas.
- Autonomous mobile robots and industrial robotics account for 26.2%, valued at USD 9,379.6 million, with the largest deployed population of any class because warehouses remove the approval dependency entirely.
- Drones and unmanned aerial systems account for 18.4%, valued at USD 6,587.2 million.
- However, the humanoid and general-purpose robots segment, valued at USD 3,436.8 million in 2026 and accounting for a share of 9.6%, is projected to register the highest CAGR of 42.6% during the forecast period.
- The rapid growth of this segment is attributed to deployment in segregated industrial cells where the absence of a standard covering mobile general-purpose robots does not apply, to workstations built for people that cannot be economically rebuilt for fixed arms, and to a starting base small enough that a single volume programme moves the segment.
- Other embodied systems covering autonomous marine and underwater vessels, autonomous off-highway and heavy machinery and legged platforms account for 7.2%, valued at USD 2,577.6 million, where autonomy is retrofitted onto equipment already positioned at the worksite rather than sold as a new machine, which makes the installed equipment population the addressable base.
- Within autonomous vehicles, passenger vehicles and robotaxis hold the largest sub-share on the strength of commercial service areas now in revenue operation, while trucks and heavy commercial vehicles grow fastest as corridor operations convert the highest-mileage duty cycles in the segment.
- Autonomous vehicles and autonomous driving systems, with a 38.6% share in 2026 valued at USD 13,818.8 million.
By Offering
- The hardware segment is expected to account for the largest share of 54.2% of the market, valued at USD 19,403.6 million.
- The large share of this segment is mainly due to the sensing, actuation, compute and power content in every deployed platform, with sensing and actuation rather than processing now dominating platform cost.
- However, the software segment, valued at USD 11,241.2 million in 2026 and accounting for a share of 31.4%, is projected to register the highest CAGR of 30.0% during the forecast period.
- The rapid growth of this segment is attributed to validation and simulation workloads that scale with the variety of the operating environment rather than with unit shipments, and to compute suppliers shipping maintained software stacks that raise the software content of each platform.
- Software revenue also recurs for as long as a machine operates, where hardware is recognised once at shipment, so the software share rises on an installed base that grows faster than annual shipments.
- Services account for 14.4%, valued at USD 5,155.2 million, growing at a CAGR of 27.4%, concentrated in integration, safety case preparation and operations support where no standard specifies the required work and the operator consequently buys the expertise rather than developing it.
- Service intensity is highest in the humanoid and drone classes, where each deployment carries a bespoke approval basis, and lowest in warehouse robotics, where repeat installations have standardised.
- Hardware, with a 54.2% share in 2026 valued at USD 19,403.6 million.
- Software, at a CAGR of 30.0%, valued at USD 11,241.2 million in 2026, against 26.4% for hardware.
- Healthcare, retail and other services, at a CAGR of 30.4%, valued at USD 2,649.2 million in 2026.
By Autonomy Level
- The supervised autonomy segment, in which a person remains in the loop, is expected to account for the largest share of 48.6% of the market, valued at USD 17,398.8 million.
- The large share of this segment is mainly due to approval regimes that require a person to retain control, including the requirement for a remote pilot per unmanned aircraft and site rules that keep an operator present for mobile machines working near people.
- Conditional autonomy, with the human on the loop, accounts for 32.8%, valued at USD 11,742.4 million, growing at a CAGR of 29.4%, and is the configuration in which most warehouse and yard deployments now run.
- However, the full autonomy segment, with the human out of the loop, valued at USD 6,658.8 million in 2026 and accounting for a share of 18.6%, is projected to register the highest CAGR of 35.2% during the forecast period.
- The rapid growth of this segment is attributed to the removal of the staffed cost that otherwise sits under every operating hour, which is where the economic case for autonomy is realised, and to waivers and site approvals that permit unsupervised operation in defined envelopes.
- The distribution across autonomy levels differs sharply by platform class, with warehouse and mining machines concentrated in conditional and full autonomy while unmanned aircraft remain predominantly supervised, so the autonomy level mix follows the approval regime each class operates under rather than the capability available to it.
By End-Use Industry
- The automotive and mobility segment is expected to account for the largest share of 26.4% of the market, valued at USD 9,451.2 million, growing at a CAGR of 26.0%.
- The large share of this segment is mainly due to the autonomy content per vehicle and to the scale of development spending carried by vehicle makers and ride-hailing operators.
- Logistics and warehousing accounts for 21.8%, valued at USD 7,804.4 million, growing at a CAGR of 28.4%, and carries the largest deployed machine population because the environment is controlled by one operator.
- Manufacturing accounts for 16.2%, valued at USD 5,799.6 million, and defence and security for 12.6%, valued at USD 4,510.8 million, where uncrewed systems are procured for reasons that do not depend on commercial payback.
- Agriculture accounts for 8.4%, valued at USD 3,007.2 million, and construction and mining for 7.2%, valued at USD 2,577.6 million, both adopting early because the work is remote, repetitive and hard to staff.
- However, the healthcare, retail and other services segment, valued at USD 2,649.2 million in 2026 and accounting for a share of 7.4%, is projected to register the highest CAGR of 30.4% during the forecast period.
- The rapid growth of this segment is attributed to service tasks in public-facing environments that have become addressable as navigation among people has improved, and to a base small enough that individual rollouts move the segment.
- Defence and security demand is the least sensitive to commercial payback of any industry here, and procurement volumes respond to programme cycles rather than to labour cost.
Geographic analysis
North America
Largest shareIn 2026, North America is expected to account for the largest share of 36.8% of the global physical AI market, valued at USD 13,174.4 million, growing at a CAGR of 27.0% during the forecast period. The large share of this region is mainly due to the concentration of autonomy compute and software suppliers and of venture-funded platform developers in the United States, to commercial ride-hailing operation in defined service areas in several cities, and to a drone waiver process that allows operations beyond the baseline rules where an operator can evidence a safety case. Canada contributes a smaller base weighted toward mining and resource autonomy where remote sites and seasonal access make staffed operation expensive, and where oil sands and open pit operations run the duty cycles that autonomy converts earliest in the equipment cycle.
Asia-Pacific
Fastest growthAsia-Pacific accounts for 34.6% of the market in 2026, valued at USD 12,386.8 million, and is projected to register the highest CAGR of 30.0% during the forecast period. China leads on manufacture of mobile robots, drones and humanoid platforms together with the largest domestic deployment programmes, Japan and South Korea contribute the established industrial robotics and component base, and India contributes rapidly growing warehouse automation demand. The region also benefits from supply chains for actuators, reducers and sensing components being located alongside platform assembly, which shortens development cycles for new platform classes.
Europe
Europe accounts for 22.4% of the market in 2026, valued at USD 8,019.2 million, at a CAGR of 25.4%. Germany, France, the Nordic countries, the Netherlands and Italy lead, with the regional position built on industrial robotics, automotive autonomy development and port and logistics automation. Machinery safety practice in the region is well established and applied rigorously, which slows the introduction of machine classes that existing standards do not cover while making approvals more portable once granted.
Middle East & Africa
The Middle East & Africa accounts for 3.6% of the market in 2026, valued at USD 1,288.8 million, at a CAGR of 28.2%, concentrated in Saudi Arabia and the United Arab Emirates where new logistics, mining and urban development projects specify autonomy from the outset and where labour for outdoor work is expensive to secure.
Latin America
Latin America accounts for 2.6%, valued at USD 930.8 million, at a CAGR of 26.0%, with Brazil, Mexico and Chile carrying most of the activity on agricultural autonomy in row crops and on haul truck autonomy in copper and iron ore mining.
Competitive landscape
Autonomy compute and software platform suppliers sell into every other participant in this market and carry no deployment risk, established robotics and vehicle manufacturers hold the industrial channel, the safety engineering and the manufacturing capability, and venture-funded specialists hold the newest platform designs with the least validated field record, so the three groups overlap rather than compete head to head. Most commercial humanoid and autonomous vehicle programmes now pair a specialist with a manufacturer through joint development, equity investment or contract manufacturing, because the platform and the channel are both necessary and rarely held by the same organisation.
Competition among the platform suppliers runs on the software stack shipped with the silicon rather than on processing performance, because a customer that builds a perception and validation pipeline on one vendor stack carries a multi-year switching cost. That has turned compute selection into an architectural commitment and given the leading supplier a position across automotive, robotics and drone customers simultaneously, which no platform manufacturer holds.
Among operators, capability accrues to whoever is already running machines, since the conditions a fleet meets in service generate the training and validation cases a later entrant cannot obtain. Data rights have consequently become a negotiated term in supply agreements, with suppliers seeking access to what their machines record on customer sites and operators pricing it as an asset. Privately held humanoid developers in the United States and China have attracted substantial funding on the strength of platform design, and their field hours accumulate against a runway that will require a revenue base. Established manufacturers hold the channel and the safety engineering while depending on partners for the platform designs customers are asking about, and partnership rather than acquisition has been the prevailing structure between the two.
Some of the key players operating in the physical AI market are NVIDIA Corporation, Tesla, Inc., Alphabet Inc., Amazon.com, Inc., Intel Corporation, Qualcomm Incorporated, ABB Ltd, FANUC CORPORATION, Yaskawa Electric Corporation, Kawasaki Heavy Industries, Ltd., Hyundai Motor Company, Honda Motor Co., Ltd., Symbotic Inc., Teradyne, Inc., Rockwell Automation, Inc., SZ DJI Technology Co., Ltd., and AeroVironment, Inc., among others.
- —
ISO 10218-1:2025 was published in February 2025 as the third version of the industrial robot safety standard and excludes robots forming part of mobile platforms, public-access service robots and the transporting of people, leaving general-purpose mobile humanoids outside its scope.
- NVIDIA Corporation
- Tesla, Inc.
- Alphabet Inc.
- Amazon.com, Inc.
- Intel Corporation
- Qualcomm Incorporated
- ABB Ltd
- FANUC CORPORATION
- Yaskawa Electric Corporation
- Kawasaki Heavy Industries, Ltd.
- Hyundai Motor Company
- Honda Motor Co., Ltd.
- Symbotic Inc.
- Teradyne, Inc.
- Rockwell Automation, Inc.
- SZ DJI Technology Co., Ltd.
- AeroVironment, Inc.
Expert perspectives
Capability in this market has run ahead of permission for several years, and the figures reflect where machines are allowed to work rather than where they could. The industrial robot safety standard excludes mobile platforms and public-access service robots, and the small unmanned aircraft rules permit one aircraft per remote pilot without a waiver, so the two fastest-growing segments are both governed by instruments that do not contemplate them. Engineering capability is no longer what limits deployment, and the approval basis an operator can replicate from one site to the next now sets the pace instead.
Simulation, synthetic data and scenario validation sell into every platform class at once and recur for as long as a fleet operates, safety case preparation and operations support are bought as services where no standard specifies the work, and a drone waiver or a site risk assessment carries more value than the hardware it covers. Spending moves toward whatever produces an approval basis, and software consequently grows faster than hardware throughout the forecast even though hardware remains the larger share.
Field hours rather than demonstrations are what compounds for a company entering or expanding in this market. An operator accepts open-floor or public operation only against accumulated hours and incident history, and the conditions a working fleet encounters generate the cases that improve the model, so early narrow deployment builds a position a later entrant cannot purchase. Entrants without safety engineering and regulatory capability partner with a manufacturer rather than carry a machine to qualification alone.
The humanoid growth rate of 42.6% compounds from a base of USD 3,436.8 million, so the segment stays a minority of the market throughout the forecast and a single volume programme moves it more than any industry trend. Vehicle autonomy revenue is counted at the value of the driving system rather than of the vehicle, which places the segment figure far below headline vehicle sales for the same platforms. The blended average selling price spans platform classes differing by three orders of magnitude, so its decline comes from the shifting mix between them and not from price pressure within any class. Standards work and waiver practice remain the largest swing factors in the forecast, and a standard covering general-purpose mobile robots in workplaces would lift the humanoid trajectory further than any advance in the machines themselves.
Growth in this market rests on labour costs and duty cycles that operators already carry, and it is paced by permission rather than by capability. Suppliers that shorten the path to an approved deployment will take a disproportionate share of the increase.
Customer perspectives
Operator-controlled environments remove the approval dependency that paces public road and airspace deployment, which is why logistics and warehousing carries the largest deployed machine population in this market at a CAGR of 28.4% and the shortest route from pilot to repeat order in this market.
The exclusion of mobile platforms and public-access service robots from the industrial robot safety standard is why humanoid adoption begins in segregated cells, and why the segment grows at 42.6% from a commercial base of USD 3,436.8 million rather than from fleet orders.
The one-aircraft rule and the visual line of sight requirement place a staffed cost under every flight hour, which makes the waiver rather than the airframe the commercial asset, directs autonomy spending toward detect and avoid capability, and keeps supervised autonomy the largest autonomy level in this market at a share of 48.6% in 2026.
“Inside our four walls we set the rules, so we can put machines to work without waiting for anyone to approve it, and that is why almost everything we have deployed is in the building rather than on the road. The business case is the vacancy rate on night shift, not the price of the robot.”
“We can buy a humanoid today, but putting it on the open floor next to people means writing our own safety justification, and our insurer wants to see the standard it conforms to. Inside a fenced cell it is just another machine, so that is where we started.”
“One pilot for one aircraft makes an unmanned flight cost about what a crewed one costs, so the whole economics sit in the waiver. We spend more on the safety case and the procedures than on the aircraft.”
Frequently asked questions
The market was valued at USD 27.60 billion in 2025 and USD 21.40 billion in 2024, and is estimated at USD 35.80 billion in 2026.
Cite this report
Meticulous Research. (2026). Physical AI Market - Global Opportunity Analysis and Industry Forecast (2026-2036) (Report No. MRICT - 1042463). Meticulous Market Research Pvt. Ltd. https://www.meticulousresearch.com/product/physical-ai-market-7146