AI in Pharmaceutical Manufacturing Market (2026-2036)
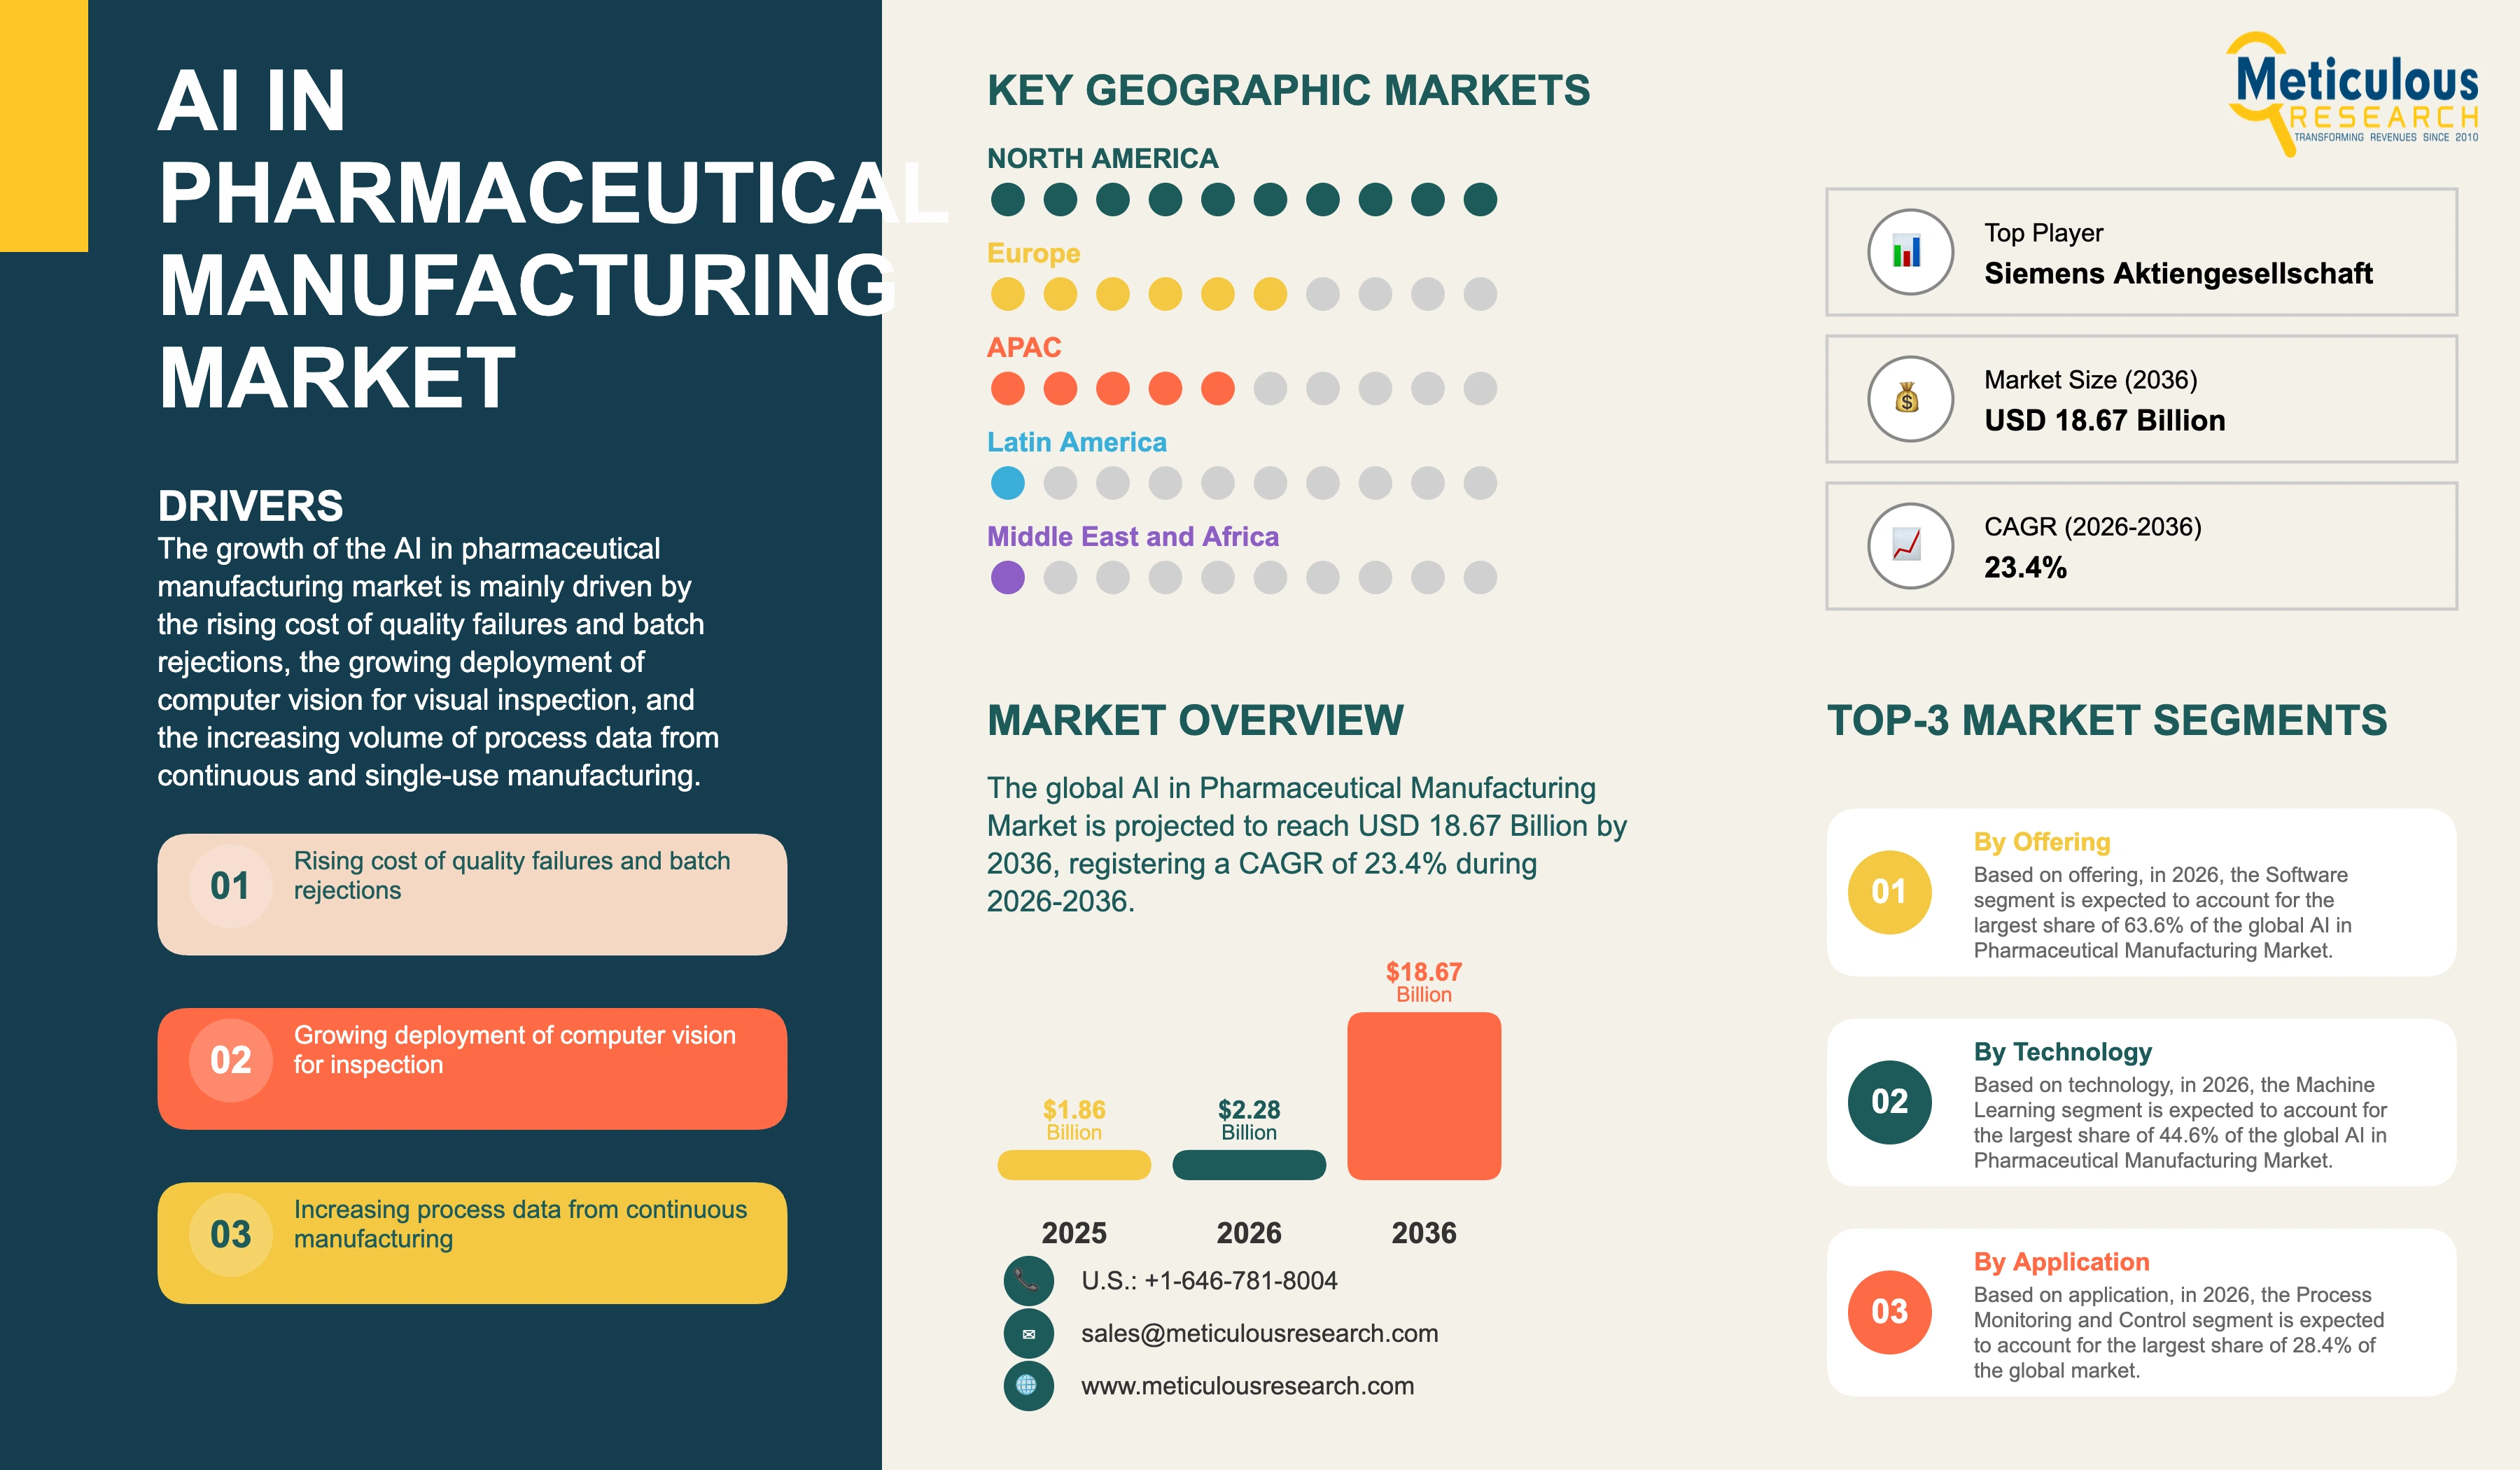
The global AI in pharmaceutical manufacturing market was valued at USD 1.86 billion in 2025. This market is expected to reach USD 18.67 billion by 2036 from an estimated USD 2.28 billion in 2026, registering a CAGR of 23.4% during the forecast period (2026-2036).
- Published
- Nov 2026
- Pages
- 255
- Format
- PDF + Excel
- Report ID
- MRHC - 1042462
- Base year
- 2025
- 2025 · BASELINE
- $1.86B
- 2036
- $18.67B
- CAGR 2026–2036
- 23.4%
2025 baseline · 2026–2036 forecast at 23.4% CAGR · hover a bar for the value
Key highlights
AspenTech became a wholly owned subsidiary of Emerson Electric Co. on 12 March 2025, consolidating process optimisation software under a single automation owner.
The European Medicines Agency reflection paper on AI in the medicinal product lifecycle was adopted in September 2024 and states that GMP standards for AI are still awaiting revision.
The US Food and Drug Administration published its draft credibility assessment framework for AI supporting regulatory decision-making on 7 January 2025, as non-binding draft guidance.
Validation and qualification services account for 29.4% of services revenue in 2026, the fastest-growing services line in the market.
Models are deployed frozen and version-controlled because computerised system rules require evidence of consistent intended performance, which makes retraining a change-control event.
Contract development and manufacturing organisations are the fastest-growing end user group at a CAGR of 26.2%, ahead of large pharmaceutical companies.
Environmental monitoring and contamination control is the fastest-growing application at a CAGR of 27.4%, from the smallest application base in 2026.
By offering, software accounts for the largest share of 63.6% in 2026, while services register the highest CAGR of 24.5% during the forecast period.
By technology, machine learning accounts for the largest share of 44.6%, while natural language processing and generative AI register the highest CAGR of 30.6%.
By application, process monitoring and control accounts for the largest share of 28.4%, while environmental monitoring and contamination control registers the highest CAGR.
By deployment mode, cloud accounts for the largest share of 54.6% and also the higher CAGR of 25.4%.
By end user, large pharmaceutical companies account for the largest share of 48.2%, while contract development and manufacturing organisations register the highest CAGR.
By geography, North America accounts for the largest share of 42.6% in 2026, while Asia-Pacific registers the highest CAGR of 26.2%.
Report summary
| Particulars | Details |
|---|---|
| Base Year | 2025 |
| Estimated Year | 2026 |
| Forecast Period | 2026-2036 |
| Market Size in 2025 | USD 1.86 billion |
| Market Size in 2026 | USD 2.28 billion |
| Market Size by 2036 | USD 18.67 billion |
| CAGR (2026-2036) | 23.4% |
| Format | PDF, Excel & Cloud Portal · 255 pages |
| Largest Segment by Offering (2026) | Software (63.6%) |
| Fastest-Growing Segment by Offering | Services (CAGR 24.5%) |
| Largest Region (2026) | North America (42.6%) |
| Fastest-Growing Region | Asia-Pacific (CAGR 26.2%) |
| Companies Profiled | 17 companies and other companies |
| Segments Covered | Offering, Technology, Application, Deployment Mode, End User, Geography |
| Countries Covered | U.S., Canada, Germany, U.K., France, Italy, Spain, Switzerland, Ireland, Denmark, Sweden, Rest of Europe, China, Japan, India, South Korea, Australia, Singapore, Rest of Asia-Pacific, Brazil, Mexico, Argentina, Rest of Latin America, Saudi Arabia, U.A.E., Israel, South Africa, Rest of Middle East & Africa |
Report overview
Segments covered: offering, technology, application, deployment mode, end user.
The growth of this market is mainly driven by the rising cost of quality failures and batch rejections in commercial manufacturing, the growing deployment of computer vision for visual inspection and container closure defect detection, the increasing volume of process data generated by continuous manufacturing and single-use bioprocessing lines, and the expanding use of machine learning to shorten deviation investigation and batch release cycles. However, factors such as the validation burden created by computerised system requirements that demand consistent intended performance, the absence of a revised GMP standard specific to machine learning models, the fragmentation of manufacturing data across legacy historians and execution systems, and the shortage of staff able to qualify a model and defend it in an inspection are expected to restrain the growth of this market to some extent.
Software accounts for the larger share of spending, while services grow faster because every model placed on a regulated line carries a qualification and periodic review obligation that scales with the number of models rather than with the licence value. Cloud deployment is growing faster than on-premises deployment, although the on-premises base remains substantial because many sites keep model execution inside the plant network where the historian and the execution system already sit.
Pharmaceutical manufacturing generates a continuous record of every batch, and the economic value of applying machine learning to that record comes from avoiding loss rather than from increasing output. A rejected commercial batch of a biologic carries a direct cost in materials and occupancy plus the indirect cost of a supply interruption, and the investigation that follows consumes quality staff for weeks. Models that detect a drifting parameter before it crosses a specification limit, or that classify a visual defect more consistently than a human inspector working a shift, therefore pay back against a loss that is already on the books. That is why adoption has concentrated in quality functions and in commercial operations rather than in development, and why the spend is approved against a quality metric rather than against a productivity target.
Part 11 of Title 21 of the Code of Federal Regulations requires validation of systems to ensure accuracy, reliability and consistent intended performance together with the ability to discern invalid or altered records, and requires secure, computer-generated, time-stamped audit trails that record the date and time of entries and actions which create, modify or delete records, with record changes not obscuring previously recorded information and audit trails retained at least as long as the records themselves. Part 11 also requires accurate and complete copies of records in both human readable and electronic form, accurate and ready retrieval throughout the retention period, and computer systems that are readily available for and subject to inspection. An adaptive model that updates its own parameters in service cannot evidence consistent intended performance against a fixed qualification, so models reach regulated lines frozen, under version control, with retraining handled as a change-control event supported by a fresh performance assessment. The commercial consequence is that the number of models a site runs, not the licence value of the platform, determines the recurring cost of ownership, and that the services attached to a deployment grow faster than the software itself.
In Europe, the Reflection paper on the use of Artificial Intelligence in the medicinal product lifecycle (EMA/CHMP/CVMP/83833/2023), adopted by the CHMP on 9 September 2024 and by the CVMP on 11 September 2024 states that the principles of ICH Q8, Q9 and Q10 should be considered while revision of current regulatory requirements and GMP standards is awaited, and that model development, performance assessment and lifecycle management should follow quality risk management principles with patient safety, data integrity and product quality taken into account, which leaves regulatory expectations for manufacturing AI principle-based rather than prescriptive. The reflection paper is not binding, and the statement that GMP standards await revision means there is no AI-specific requirement to certify a product against. In the United States, the draft guidance Considerations for the Use of Artificial Intelligence To Support Regulatory Decision-Making for Drug and Biological Products, published on 7 January 2025 as a Draft Level 1 guidance marked not for implementation and carrying non-binding recommendations, which sets out a risk-based credibility assessment framework tied to a defined context of use addresses information and data intended to support regulatory decision-making on safety, effectiveness or quality, which is a separate question from a model embedded in a running line and governed by computerised system controls. Vendors therefore cannot sell compliance, only an evidence package that a quality unit can defend, and the strength of that package has become a primary selection criterion.
Visual inspection is the application where machine learning has displaced an incumbent method rather than supplementing it. Automated inspection machines have long used rule-based image processing with fixed thresholds, which rejects acceptable units when a cosmetic variation falls outside the rule and passes defects the rule does not describe. Convolutional classification trained on labelled defect libraries reduces false rejects while holding detection, and the saving is measurable in units recovered per million filled. That makes inspection the easiest application to justify and the one where equipment makers rather than software vendors hold the account.
Deviation and batch record review is the application with the largest unrealised volume. A commercial site may open thousands of deviations a year, each requiring classification, root cause attribution and a disposition that is recorded and reviewed. Language models that draft the narrative, retrieve comparable prior cases and propose a classification compress the cycle without taking the disposition decision, which remains with a named person. That division of labour keeps the human accountable for the regulated judgement and keeps the model in an advisory role that is simpler to qualify, and it is the reason natural language processing and generative techniques grow faster than any other technology group in this market.
Process historians, manufacturing execution systems, laboratory information systems and building management systems were commissioned at different times with different time bases and tag conventions, and aligning them to a batch genealogy is the precondition for any model that spans unit operations, which makes data readiness the factor that decides how much of a site can be addressed at all. Sites that completed a historian consolidation can deploy across a line in months, while sites that have not spend the first phase of a programme on contextualisation. Implementation and integration consequently remains the largest services line and the entry point for most vendor relationships.
Margins at contract development and manufacturing organisations depend on throughput and right-first-time performance across many products rather than on the economics of a single molecule, so a yield or inspection gain applies across a portfolio of client programmes and makes this the fastest-growing buyer group in the market. These organisations also carry audit scrutiny from every client, which makes a defensible model lifecycle a commercial asset rather than only a compliance cost. Large pharmaceutical companies remain the largest buyer group because they own the most commercial lines and the largest quality organisations.
Cloud, with a 54.6% share in 2026 valued at USD 1,244.9 million.
Cloud, at a CAGR of 25.4%, against 21.0% for on-premises deployment.
North America, with a 42.6% share in 2026 valued at USD 971.3 million, at a CAGR of 22.8%.
Asia-Pacific, at a CAGR of 26.2%, valued at USD 528.9 million in 2026.
Europe accounts for 27.4% of the market in 2026, valued at USD 624.7 million, at a CAGR of 22.4%, led by Germany, Switzerland, Ireland and Denmark.
The Middle East & Africa accounts for 2.6% in 2026, valued at USD 59.3 million, at a CAGR of 23.0%, and Latin America for 4.2%, valued at USD 95.8 million, at a CAGR of 22.0%.
The report profiles 17 companies, including Siemens Aktiengesellschaft, Schneider Electric SE, ABB Ltd, Honeywell International Inc., Emerson Electric Co. and Rockwell Automation, Inc. The top five players account for an estimated 38.4% of the market in 2026.
Offering, technology, application, deployment mode, end user and geography, with country-level analysis across 28 countries and regions.
Market sizing is on a value basis in USD, covering software licence and subscription revenue and associated services revenue.
The top five players account for an estimated 38.4% of the market in 2026, with the remainder spread across automation vendors, equipment makers, enterprise software companies and specialist suppliers.
Machine learning, with a 44.6% share in 2026 valued at USD 1,016.9 million.
Natural language processing and generative AI, at a CAGR of 30.6%, valued at USD 396.7 million in 2026.
Environmental monitoring and contamination control, at a CAGR of 27.4%, valued at USD 150.5 million in 2026.
Large pharmaceutical companies, with a 48.2% share in 2026 valued at USD 1,099.0 million.
Contract development and manufacturing organisations, at a CAGR of 26.2%, valued at USD 629.3 million in 2026.
Report infographic
Market dynamics
15 factors across 5 forcesRising cost of quality failures and batch rejections in commercial manufacturing
The value destroyed by a single rejected commercial batch of a biologic runs to a multiple of the annual licence cost of a predictive quality platform, and the investigation that follows occupies quality assurance and technical services staff who are already the constraint on site throughput. Models trained on historical batch records identify parameter combinations that preceded prior excursions and raise an alert while the batch is still recoverable, which converts a write-off into a controlled intervention. Because the loss being avoided is already recorded in the site cost base, the business case does not depend on a forecast of improved output and clears capital approval more readily than a capacity project of the same value.
Right-first-time performance has also become a contractual metric in manufacturing and supply agreements, particularly where a sponsor has outsourced a commercial product. Where a rate is committed, the penalty for missing it falls on the manufacturer, and a tool that lifts the rate by a measurable amount is funded from the commercial budget rather than the IT budget. This is the mechanism behind the concentration of spending in commercial operations rather than in clinical supply.
Growing deployment of computer vision for visual inspection and defect detection
Rule-based image processing on automated inspection machines sets fixed thresholds against a defined feature set, which produces false rejects when an acceptable cosmetic variation falls outside the rule and misses defects the rule does not describe. Classification models trained on labelled defect libraries hold detection while reducing false rejects, and the recovered units are counted directly per million filled. For a high-value parenteral product the recovery alone funds the retrofit, which is why inspection is the application with the shortest approval cycle in this market.
Inspection platforms already installed on filling lines can in many cases take a model as a software layer over the existing camera and lighting hardware, which avoids a requalification of the machine itself and keeps the change within the scope of a software change control. That lowers the barrier for a site that cannot take a line out of service, and it places the equipment maker rather than an independent software vendor at the centre of the account, which makes the retrofit path as commercially decisive as the performance gain itself.
Increasing volume of process data from continuous manufacturing and single-use bioprocessing
Continuous processing and single-use bioprocessing lines are instrumented more densely than the batch stainless steel plant they replace, generating spectroscopic, pressure, flow and single-use sensor streams at a frequency that no review-by-exception process can read manually. Models are the only practical way to convert those streams into a release-relevant signal, which ties AI adoption to the installed base of newer process technology rather than to the age of the site. Facilities commissioned in the last several years therefore adopt earlier and deeper than older plants running the same product class.
Where an attribute such as titre or concentration is measured offline with a laboratory turnaround, a model trained against spectroscopic inputs provides a continuous estimate that supports an in-process decision without waiting for the assay. The laboratory measurement remains the reference and the release basis, and the model functions as a control input, which keeps the qualification scope narrow and the adoption rapid.
Expanding use of machine learning to shorten deviation investigation and batch release
Deviation management consumes a large and measurable share of quality unit capacity at a commercial site, and the work is largely retrieval and drafting rather than judgement. Retrieval of comparable prior cases, automatic drafting of the investigation narrative and proposed classification compress the cycle while leaving the disposition with a named reviewer. Because the regulated decision stays with a person, the model operates in an advisory capacity, which is substantially easier to qualify than a model that acts on the process.
Shorter investigation cycles release inventory faster, which converts a quality improvement into a working capital gain that finance recognises. Sites that have reduced average investigation duration report the benefit in days of inventory rather than in staff hours saved, and that framing has moved batch record and deviation tooling from a quality project into a supply chain project with a larger budget behind it.
Table of contents
13 chapters · 149 sections · 255 pages · click to expandSegmental analysis
| Segment | Largest share (2026) | Fastest growth (2026–2036) |
|---|---|---|
| By Offering | Software | Rapid growth of this |
| By Technology | Machine learning | Rapid growth of this |
| By Application | Process monitoring and control | Rapid growth of this |
| By Deployment Mode | Cloud | Large share and rapid growth of this |
| By End User | Large pharmaceutical companies | Rapid growth of this |
By Offering
- AI in Pharmaceutical Manufacturing Market Analysis by Offering
- The software segment is expected to account for the largest share of 63.6% of the global AI in pharmaceutical manufacturing market, valued at USD 1,450.1 million.
- The large share of this segment is mainly due to the licence and subscription value of predictive quality, inspection and maintenance platforms being recognised at the point of deployment, and to the concentration of early adoption in applications that are delivered as configurable products rather than bespoke builds.
- Within software, predictive quality and process analytics accounts for 31.2%, followed by visual inspection and defect detection at 24.6%, predictive maintenance and asset reliability at 18.4%, deviation, CAPA and batch release automation at 14.2% and scheduling, yield and supply optimisation at 11.6%.
- However, the services segment, valued at USD 829.9 million in 2026 and accounting for a share of 36.4%, is projected to register the highest CAGR of 24.5% during the forecast period.
- The rapid growth of this segment is attributed to the qualification, change control and periodic review obligations that attach to each deployed model and scale with model count rather than licence value, and to the contextualisation work required before any model can span unit operations.
- Within services, implementation and integration accounts for 38.6%, validation and qualification for 29.4%, consulting for 17.2% and support and managed services for 14.8%, with the mix shifting from integration toward validation and qualification as the installed model base at each site grows.
- Software, with a 63.6% share in 2026 valued at USD 1,450.1 million, of which predictive quality and process analytics accounts for 31.2%.
- Services, at a CAGR of 24.5%, valued at USD 829.9 million in 2026, with validation and qualification accounting for 29.4% of services.
By Technology
- AI in Pharmaceutical Manufacturing Market Analysis by Technology
- The machine learning segment is expected to account for the largest share of 44.6% of the market, valued at USD 1,016.9 million.
- The large share of this segment is mainly due to its use in predictive quality, soft sensing and asset reliability, which are the applications with the longest deployment history and the clearest loss-avoidance case in commercial manufacturing.
- Computer vision accounts for 26.2%, valued at USD 597.4 million, supported by the installed base of automated inspection equipment that can accept a classification model over existing cameras.
- However, the natural language processing and generative AI segment, valued at USD 396.7 million in 2026 and accounting for a share of 17.4%, is projected to register the highest CAGR of 30.6% during the forecast period.
- The rapid growth of this segment is attributed to the volume of documents a commercial site produces and reviews, and to the advisory position of these tools in the workflow, where a person reviews output before it carries regulatory weight and the qualification scope stays narrow.
- Other technologies including reinforcement learning and physics-informed hybrid modelling account for 11.8%, valued at USD 269.0 million, concentrated in scheduling and yield applications where a learned policy is evaluated against a process model rather than applied directly to the equipment.
By Application
- AI in Pharmaceutical Manufacturing Market Analysis by Application
- The process monitoring and control segment is expected to account for the largest share of 28.4% of the market, valued at USD 647.5 million.
- The large share of this segment is mainly due to the density of instrumentation on continuous and single-use lines and to soft sensing applications that provide a continuous estimate of an attribute otherwise measured offline, with the laboratory result retained as the release basis.
- Quality control and visual inspection accounts for 24.8%, valued at USD 565.4 million, and predictive maintenance for 16.6%, valued at USD 378.5 million.
- Batch record review and deviation management accounts for 14.4%, valued at USD 328.3 million, and production scheduling and yield optimisation for 9.2%, valued at USD 209.8 million.
- However, the environmental monitoring and contamination control segment, valued at USD 150.5 million in 2026 and accounting for a share of 6.6%, is projected to register the highest CAGR of 27.4% during the forecast period.
- The rapid growth of this segment is attributed to the scale of loss attached to a single aseptic contamination event, which extends beyond the batch to the qualification status of the room, and to the completeness of monitoring data that is already recorded continuously under existing requirements and needs no new instrumentation.
- Process monitoring and control, with a 28.4% share in 2026 valued at USD 647.5 million.
By Deployment Mode
- AI in Pharmaceutical Manufacturing Market Analysis by Deployment Mode
- The cloud segment is expected to account for the largest share of 54.6% of the market, valued at USD 1,244.9 million, and is also projected to register the highest CAGR of 25.4% during the forecast period.
- The large share and rapid growth of this segment are mainly due to the training and retraining workloads that sit outside the plant network, the use of multi-site model libraries that require a common environment, and the preference of vendors to ship updates through a managed service rather than through site-by-site installation.
- On-premises deployment, valued at USD 1,035.1 million in 2026 and accounting for a share of 45.4%, grows at a CAGR of 21.0%, held by sites that keep model execution adjacent to the historian and the execution system for latency and qualification reasons, and by programmes where the validated state of the plant network makes an external dependency difficult to justify.
- The on-premises base therefore declines as a share of the market without contracting in absolute value over the forecast period.
By End User
- AI in Pharmaceutical Manufacturing Market Analysis by End User
- The large pharmaceutical companies segment is expected to account for the largest share of 48.2% of the market, valued at USD 1,099.0 million.
- The large share of this segment is mainly due to the number of commercial lines these companies operate, the size of their quality organisations and their ability to fund a multi-year programme across a network rather than a single site.
- However, the contract development and manufacturing organisations segment, valued at USD 629.3 million in 2026 and accounting for a share of 27.6%, is projected to register the highest CAGR of 26.2% during the forecast period.
- The rapid growth of this segment is attributed to margins that depend on throughput and right-first-time performance across many products rather than on the economics of one molecule, and to client audit scrutiny that converts a documented model lifecycle into a commercial asset.
- Biotechnology and emerging pharmaceutical companies account for 14.8%, valued at USD 337.4 million, concentrated in process development carried into early commercial supply, and generic manufacturers for 9.4%, valued at USD 214.3 million, where the lower unit value of product limits the loss that a model can avoid and holds adoption to inspection and maintenance applications.
Geographic analysis
North America
Largest shareIn 2026, North America is expected to account for the largest share of 42.6% of the global AI in pharmaceutical manufacturing market, valued at USD 971.3 million, growing at a CAGR of 22.8% during the forecast period. The large share of this region is mainly due to the concentration of commercial biologics capacity in the United States, the maturity of computerised system expectations that gives quality units a defined framework to qualify against, and the presence of the automation and software vendors that supply the market. The United States accounts for the substantial majority of the regional figure, with Canada contributing a smaller base weighted toward contract manufacturing.
Europe
Europe accounts for 27.4% of the market in 2026, valued at USD 624.7 million, at a CAGR of 22.4%. Adoption is led by Germany, Switzerland, Ireland and Denmark, where commercial biologics and sterile capacity is concentrated and where network-level programmes run across multiple sites. The adoption of the European reflection paper on AI in the medicinal product lifecycle in September 2024 gave quality units a stated expectation to work to, and its statement that GMP standards await revision has kept scope focused on advisory applications. Ireland and Switzerland punch above their population in this market because they host manufacturing for products sold globally rather than domestic demand.
Asia-Pacific
Fastest growthAsia-Pacific accounts for 23.2% of the market in 2026, valued at USD 528.9 million, and is projected to register the highest CAGR of 26.2% during the forecast period. Growth is led by China, India, Japan and South Korea, where newly commissioned capacity is instrumented from the outset and where contract manufacturers competing for Western-regulated work treat a documented model lifecycle as a qualification for that work. India contributes the largest volume of sites, concentrated in generics and contract manufacturing, while Japan and South Korea contribute higher value per site in biologics.
Latin America
Latin America accounts for 4.2% of the market in 2026, valued at USD 95.8 million, at a CAGR of 22.0%, with Brazil and Mexico carrying most of the activity on the back of regional supply for domestic and neighbouring markets.
Middle East & Africa
The Middle East & Africa accounts for 2.6%, valued at USD 59.3 million, at a CAGR of 23.0%, concentrated in Saudi Arabia, the United Arab Emirates and South Africa where new local manufacturing capacity is being established with current-generation automation and therefore adopts analytics as part of the original specification rather than as a retrofit.
Competitive landscape
The competitive structure of this market divides between automation and instrumentation companies that own the control and data layer at the site, equipment makers that own the inspection and packaging machines where vision models run, and enterprise software companies that own the quality and execution record. Automation owners have been acquiring the analytics layer rather than partnering with it, and AspenTech became a wholly owned subsidiary of Emerson Electric Co. on 12 March 2025, which placed process optimisation and modelling software inside a vendor that already holds the control contract at many sites. Because that acquisition makes Aspen Technology part of Emerson, it is not listed separately in this report.
Equipment makers hold a structural advantage in visual inspection because a model has to be qualified against the machine it runs on and the maker owns the machine documentation that the qualification references. Software vendors reach the same application through those makers rather than around them, which has concentrated inspection analytics among a small number of suppliers of filling and inspection lines. In deviation management and batch record review the advantage sits with the owners of the quality and execution systems, where the record and the workflow already live and where a language model can be embedded without a new system of record.
Competition is increasingly on the strength of the evidence package rather than on model performance. Buyers evaluate training data provenance, documented intended use, performance monitoring against predefined acceptance criteria and the retraining pathway, because those are the artefacts a quality unit has to defend. Vendors that cannot supply them lose at the quality review stage regardless of benchmark results, and this has favoured suppliers with an existing regulated footprint over entrants from general industrial analytics.
Some of the key players operating in the AI in pharmaceutical manufacturing market are Siemens Aktiengesellschaft, Schneider Electric SE, ABB Ltd, Honeywell International Inc., Emerson Electric Co., Rockwell Automation, Inc., Yokogawa Electric Corporation, Dassault Systemes SE, Koerber AG, Veeva Systems Inc., Sartorius Aktiengesellschaft, Danaher Corporation, Thermo Fisher Scientific Inc., Syntegon Technology GmbH, Stevanato Group S.p.A., Tulip Interfaces, Inc., and SAP SE, among others.
- —
AspenTech became a wholly owned subsidiary of Emerson Electric Co. on 12 March 2025. The European Medicines Agency adopted its reflection paper on AI in the medicinal product lifecycle in September 2024, and the U.S. Food and Drug Administration published draft guidance on AI supporting regulatory decision-making on 7 January 2025.
- Siemens Aktiengesellschaft
- Schneider Electric SE
- ABB Ltd
- Honeywell International Inc.
- Emerson Electric Co.
- Rockwell Automation, Inc.
- Yokogawa Electric Corporation
- Dassault Systemes SE
- Koerber AG
- Veeva Systems Inc.
- Sartorius Aktiengesellschaft
- Danaher Corporation
- Thermo Fisher Scientific Inc.
- Syntegon Technology GmbH
- Stevanato Group S.p.A
- Tulip Interfaces, Inc.
- SAP SE
Expert perspectives
The value in this market comes from loss avoided rather than output gained, and the loss is already recorded in the site cost base, which is why adoption clears approval faster than a capacity project of the same value. What limits realised value is not model capability but the control framework the model has to live inside, because a system in a regulated workflow must evidence consistent intended performance and an adaptive model cannot. The binding constraint is therefore shifting from whether a model works to whether its lifecycle can be documented and defended at the number of models a site wants to run.
Spending will move toward the artefacts that make a portfolio governable rather than toward additional model capability. Qualification tooling, version control tied to a defined intended use, performance monitoring against predefined acceptance criteria and a documented retraining pathway are what decide how many models a quality unit will accept, and they sit in a separate budget from the analytics platform. Services grow faster than software through the forecast for the same reason, and the mix shifts within services from integration toward validation and qualification as the installed model base grows.
For companies planning entry or expansion, the practical requirement is a regulated footprint rather than a performance claim. Buyers select on the evidence package, and that package references the machine, the control system or the quality record that a model attaches to, all of which are owned by incumbents. An entrant without one of those positions sells through a partner that holds it, and prices accordingly.
Four qualifications bear directly on how the growth in this market should be read. First, the market is small in absolute terms against pharmaceutical manufacturing spending as a whole, so a high growth rate compounds from a base that remains modest through the forecast. Second, signed contracts run ahead of realised deployments because qualification capacity rather than software availability sets the pace, which means revenue recognition lags commitment. Third, the application mix is concentrated in advisory use, and closed-loop control driven by a learned model stays rare in commercial GMP manufacturing until a specific standard exists, which leaves a material part of the technical opportunity outside the forecast. Fourth, the regulatory position is principle-based and not binding, so a revision of GMP standards during the forecast period would change the qualification cost per model and with it the economics of portfolio size in either direction.
Overall, the growth in this market is real and anchored in losses that manufacturers already carry, but it is paced by the cost of governing models rather than by the supply of them, and the suppliers that reduce that cost will take a disproportionate share of the increase.
Customer perspectives
Head of Global Manufacturing Quality - large pharmaceutical company, Europe
We can license a platform in a quarter and then wait two quarters for the people who can qualify what we licensed. Our limit on how many models we run is not the technology budget, it is how many evidence packages my team can own and defend in an inspection.
Qualification capacity rather than software availability sets the pace of deployment at most commercial sites, which is why services grow faster than software across the forecast and why validation and qualification is the fastest-growing services line.
Vice President of Operations - contract development and manufacturing organisation, Asia-Pacific
Every client audits us, so being able to show how a model was built, what it is approved to do and how we watch it has become part of winning the work. A yield point across twenty programmes is worth more to us than it is to a sponsor with one product.
Portfolio economics and client audit pressure together make contract manufacturers the fastest-growing buyer group in this market, at a CAGR of 26.2%, and give a documented model lifecycle a commercial rather than purely compliance value.
Site Director - sterile injectables manufacturing, North America
The inspection retrofit was the easy decision because we could do it as a software change without taking the line down, and we counted the recovered units in the first campaign. Anything that would have required requalifying the machine would still be waiting for approval.
Whether a change stays inside software change control or triggers a requalification of the equipment determines which applications a running commercial line adopts, which is why visual inspection has the shortest approval cycle, why the retrofit of installed inspection equipment is a larger opportunity than new machine orders, and why equipment makers rather than independent software vendors hold the account in this application.
Frequently asked questions
The market was valued at USD 1.86 billion in 2025 and USD 1.52 billion in 2024, and is estimated at USD 2.28 billion in 2026.
Cite this report
Meticulous Research. (2026). AI in Pharmaceutical Manufacturing Market - Global Opportunity Analysis and Industry Forecast (2026-2036) (Report No. MRHC - 1042462). Meticulous Market Research Pvt. Ltd. https://www.meticulousresearch.com/product/ai-in-pharmaceutical-manufacturing-market-7145